Exam questions · Biology · Photosynthesis
Rate of Photosynthesis and Limiting Factors
- 5 exam questions
- 12 marks
- 5 quick checks
-
1 State [1 mark]
Name two factors that can limit the rate of photosynthesis.
Show answerHide answer
Model answer
Any two of: light intensity, carbon dioxide concentration, temperature.
Mark scheme
- Two factors named — 1 mark
-
2 Explain [3 marks]
Explain why the rate of photosynthesis falls when the temperature rises above about 45 °C.
Show answerHide answer
Model answer
Photosynthesis is controlled by enzymes. At high temperatures the enzymes are denatured, because their shape changes, so they can no longer catalyse the reactions. The rate therefore falls.
Mark scheme
- Controlled by enzymes — 1 mark
- Enzymes are denatured at high temperatures — 1 mark
- So the rate falls — 1 mark
-
3 Calculate [2 marks]
A plant produces 36 cm³ of oxygen in 6 minutes. Calculate the rate of photosynthesis in cm³ of oxygen per minute.
Show answerHide answer
Model answer
36 ÷ 6 = 6 cm³ per minute.
Mark scheme
- 36 ÷ 6 — 1 mark
- 6 cm³ per minute — 1 mark
-
4 Explain [3 marks]
The rate of photosynthesis in a plant rises as the carbon dioxide concentration rises, then levels off. Explain why the graph levels off.
Show answerHide answer
Model answer
At first carbon dioxide is the limiting factor, so more carbon dioxide gives a higher rate. When the graph levels off, carbon dioxide is no longer limiting. Another factor, such as light intensity or temperature, is now limiting the rate.
Mark scheme
- Carbon dioxide limiting at first — 1 mark
- No longer limiting on the flat part — 1 mark
- Another factor is now limiting — 1 mark
-
5 Explain [3 marks]
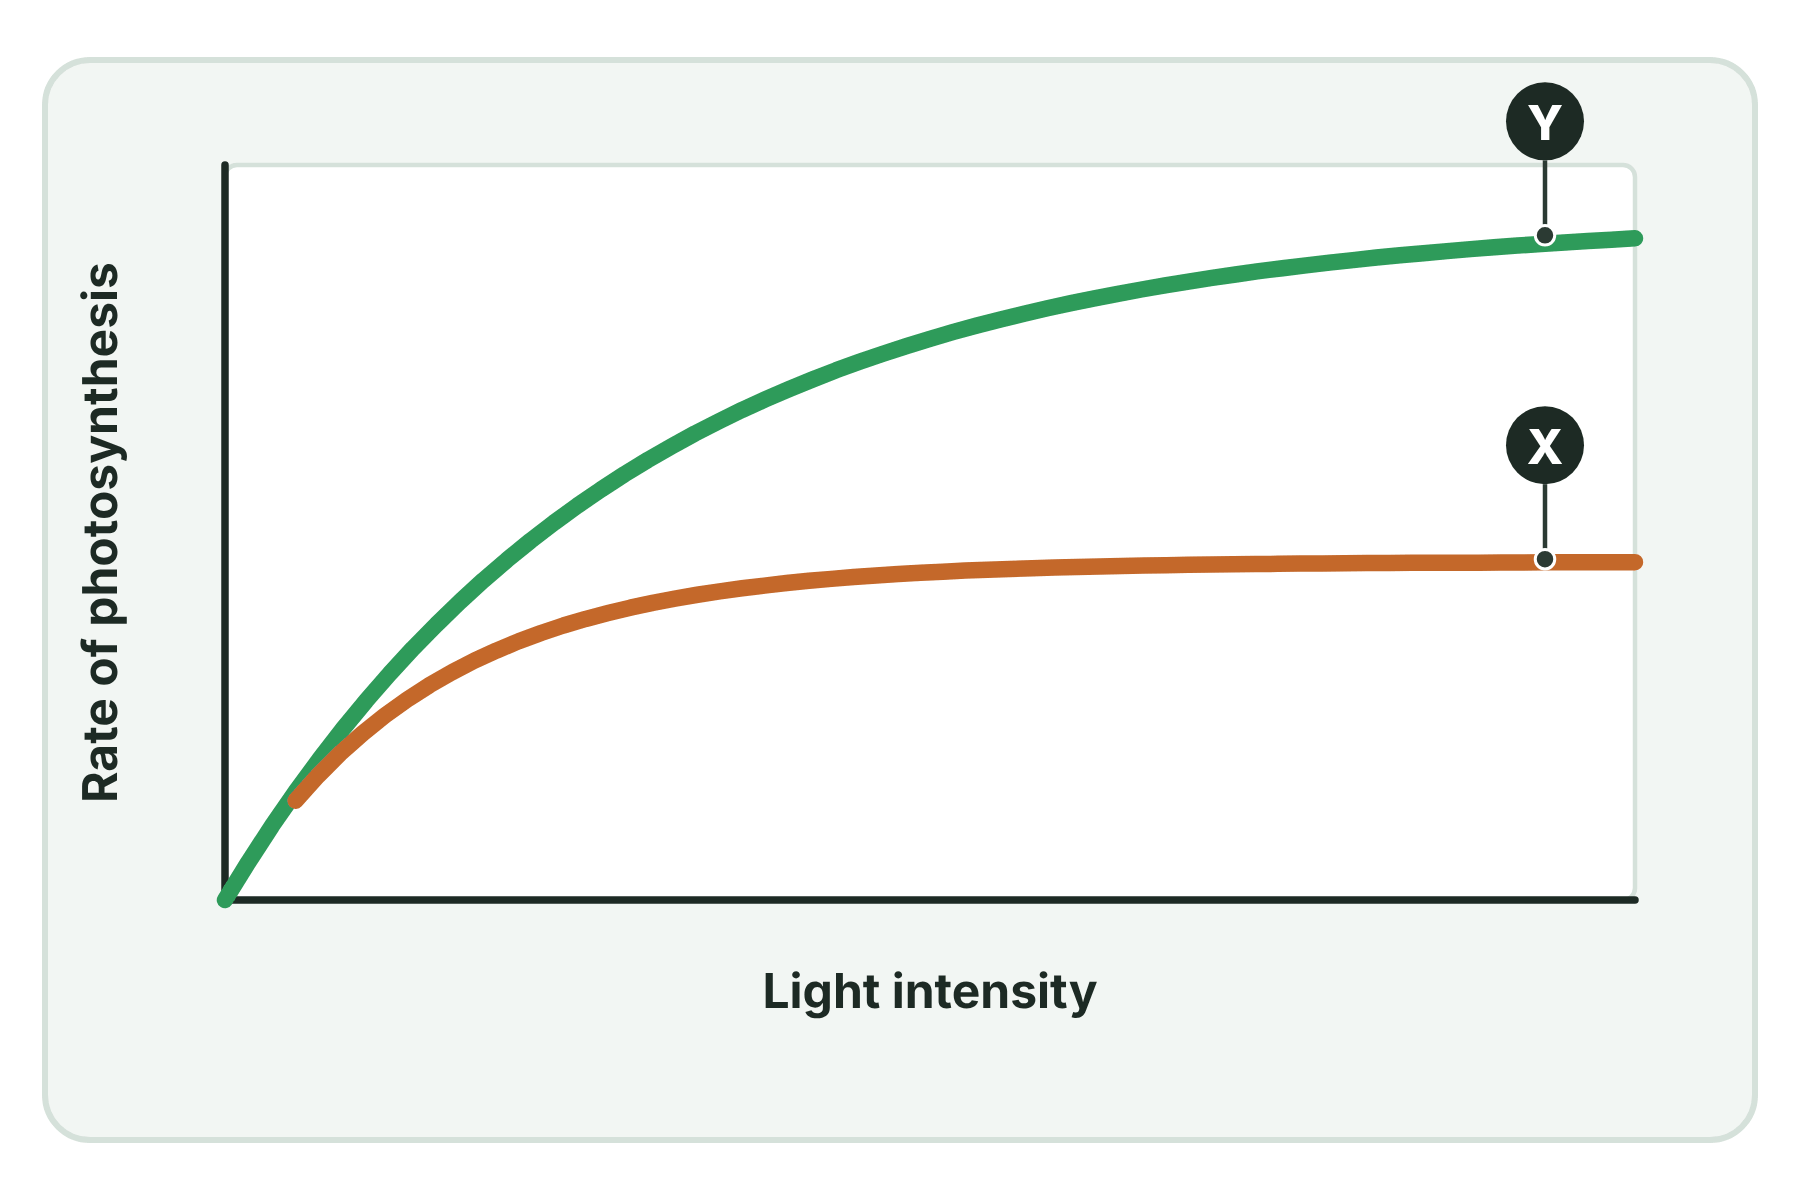
Figure 1 shows the rate of photosynthesis at different light intensities for line X at a low carbon dioxide concentration, and line Y at a higher carbon dioxide concentration. Explain why the two lines are the same at low light intensities but different at high light intensities.
Show answerHide answer
Model answer
At low light intensities, light is the limiting factor for both, so the rate is the same whatever the carbon dioxide concentration. At high light intensities, light is no longer limiting. At the lower carbon dioxide concentration, carbon dioxide is limiting so line X levels off, but at the higher carbon dioxide concentration the rate can keep rising, so line Y is higher.
Mark scheme
- Light limiting at low intensity for both — 1 mark
- Light no longer limiting at high intensity — 1 mark
- Carbon dioxide limits line X — 1 mark
Quick check
-
1
Which factor provides the energy for photosynthesis?
Show answerHide answer
C: Light
Light energy is absorbed by chlorophyll and used to make glucose.
-
2
What does the flat part of a rate graph show?
Show answerHide answer
D: Another factor is limiting
The factor on the x axis is no longer limiting, because another factor is.
-
3
Which of these is a limiting factor for photosynthesis?
Show answerHide answer
A: Carbon dioxide concentration
Carbon dioxide concentration can limit the rate.
-
4
What is the rate if 40 cm³ of oxygen is produced in 5 minutes?
Show answerHide answer
B: 8 cm³ per minute
40 ÷ 5 = 8 cm³ per minute.
-
5
(Higher tier) What can happen to a plateau on a graph if the limiting factor is increased?
Show answerHide answer
D: It rises
Raising the limiting factor raises the plateau until another factor limits.