Exam questions · Maths · Statistics
Cumulative Frequency and Box Plots
- 6 exam questions
- 20 marks
- 9 quick checks
-
1 Complete [2 marks]
The table shows the frequencies of the times taken by 100 people. The classes \(0 < t \leq 5\), \(5 < t \leq 10\), \(10 < t \leq 15\), \(15 < t \leq 20\), \(20 < t \leq 25\) and \(25 < t \leq 30\) have the frequencies 8, 17, 25, 25, 17 and 8. Write down the cumulative frequencies. [2 marks]
Show answerHide answer
Model answer
The running totals are 8, 25, 50, 75, 92 and 100.
Mark scheme
- At least four cumulative frequencies correct — M1
- 8, 25, 50, 75, 92, 100 — A1
-
2 Work out [5 marks]
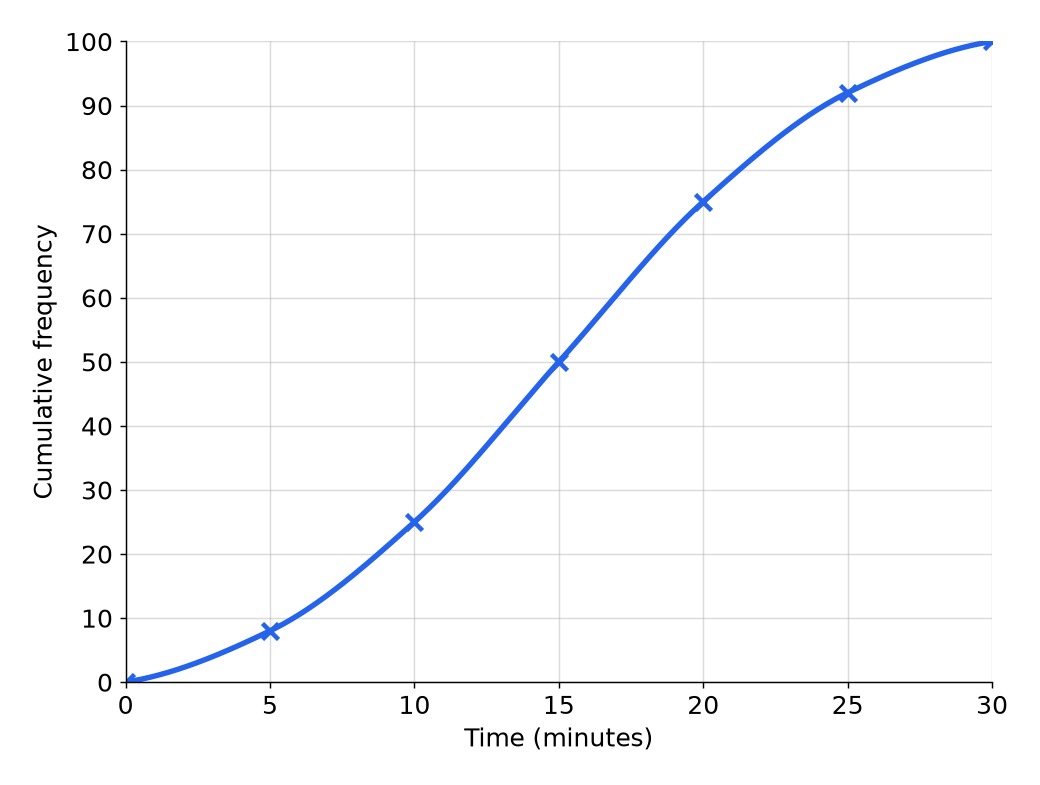
The cumulative frequency graph shows the times taken by 100 people to complete a puzzle. (a) Use the graph to find an estimate for the median time. [1 mark] (b) Use the graph to find an estimate for the interquartile range. [2 marks] (c) Use the graph to find an estimate for the number of people who took longer than 25 minutes. [2 marks]
Show answerHide answer
Model answer
(a) The median is at cumulative frequency 50, which is 15 minutes. (b) The lower quartile is at 25, which is 10 minutes, and the upper quartile is at 75, which is 20 minutes. The interquartile range is \(20 - 10 = 10\) minutes. (c) At 25 minutes the cumulative frequency is 92, so \(100 - 92 = 8\) people took longer.
Mark scheme
- (a) 15 (accept 14.5 to 15.5) — B1
- (b) Reads the quartiles at cumulative frequencies 25 and 75 — M1
- (b) 10 (accept 9 to 11) — A1
- (c) \(100 - 92\) — M1
- (c) 8 — A1
-
3 Compare [4 marks]
Box plot A shows the times for Group A: minimum 5, lower quartile 12, median 18, upper quartile 24 and maximum 40. Box plot B shows the times for Group B: minimum 8, lower quartile 14, median 18, upper quartile 20 and maximum 30. (a) Work out the interquartile range for each group. [2 marks] (b) Compare the times for the two groups. [2 marks]
Show answerHide answer
Model answer
(a) Group A: \(24 - 12 = 12\). Group B: \(20 - 14 = 6\). (b) The two groups have the same median, 18, so the typical time is the same. Group B has a smaller interquartile range, 6 compared with 12, so its times are more consistent.
Mark scheme
- (a) 12 — B1
- (a) 6 — B1
- (b) A comparison of the medians, in context — Q1
- (b) A comparison of the interquartile ranges, in context — Q1
-
4 Work out [3 marks]
The cumulative frequencies of the times, \(x\) minutes, of 100 people are 12 for \(x \leq 10\), 40 for \(x \leq 20\), 70 for \(x \leq 30\), 90 for \(x \leq 40\) and 100 for \(x \leq 50\). (a) How many people took a time in the class \(20 < x \leq 30\)? [1 mark] (b) How many people took more than 40 minutes? [1 mark] (c) Which class contains the median? [1 mark]
Show answerHide answer
Model answer
(a) \(70 - 40 = 30\). (b) \(100 - 90 = 10\). (c) The median is the 50th value, in the class \(20 < x \leq 30\), because the cumulative frequency goes from 40 to 70.
Mark scheme
- (a) 30 — B1
- (b) 10 — B1
- (c) \(20 < x \leq 30\) — B1
-
5 Explain [2 marks]
Explain why the interquartile range is often a better measure of spread than the range. [2 marks]
Show answerHide answer
Model answer
The range uses only the highest and lowest values, so one extreme value can change it a lot. The interquartile range covers the middle half of the data, so it is not affected by extreme values.
Mark scheme
- The range is affected by extreme values — B1
- The interquartile range is not affected, as it uses the middle half of the data — B1
-
6 Work out [4 marks]
A box plot shows a minimum of 12, a lower quartile of 20, a median of 28, an upper quartile of 34 and a maximum of 52. (a) Work out the range. [1 mark] (b) Work out the interquartile range. [1 mark] Another box plot has a median of 31 and an interquartile range of 8. (c) Make two comparisons of the distributions. [2 marks]
Show answerHide answer
Model answer
(a) \(52 - 12 = 40\). (b) \(34 - 20 = 14\). (c) The second distribution has a higher median, 31 compared with 28, so it is typically higher. It has a smaller interquartile range, 8 compared with 14, so it is more consistent.
Mark scheme
- (a) 40 — B1
- (b) 14 — B1
- (c) A comparison of the medians — Q1
- (c) A comparison of the interquartile ranges — Q1
Quick check
-
1
For \(n\) values, where is the median on a cumulative frequency graph?
Show answerHide answer
A: At cumulative frequency \(\dfrac{n}{2}\)
The median is the middle value.
-
2
For 100 values, at what cumulative frequency is the lower quartile?
Show answerHide answer
D: \(25\)
\(\dfrac{100}{4} = 25\).
-
3
The upper quartile is 70 and the lower quartile is 40. What is the interquartile range?
Show answerHide answer
C: \(30\)
\(70 - 40 = 30\).
-
4
Frequencies 10, 15, 25, 20, 30 are added up as you go. What are the cumulative frequencies?
Show answerHide answer
B: \(10, 25, 50, 70, 100\)
Each is the running total.
-
5
Where should the points on a cumulative frequency graph be plotted?
Show answerHide answer
A: At the upper boundary of each class
The cumulative frequency is up to the end of the class.
-
6
A cumulative frequency graph of 100 students has a cumulative frequency of 90 at a mark of 80. How many scored more than 80?
Show answerHide answer
D: \(10\)
\(100 - 90 = 10\).
-
7
Class A has an interquartile range of 30 and Class B has 15. Which is more consistent?
Show answerHide answer
C: Class B, because its IQR is smaller
A smaller interquartile range means more consistent.
-
8
For 80 values, at what cumulative frequency is the upper quartile?
Show answerHide answer
B: \(60\)
\(\dfrac{3}{4} \times 80 = 60\).
-
9
A box plot for Class B has a median of 55, and Class A has a median of 50. What can you say?
Show answerHide answer
A: Class B has the higher typical mark
A higher median means a higher typical value.