Exam questions · Maths · Functions, Sequences and Rates of Change
Rates of Change and Areas Under Graphs
- 6 exam questions
- 20 marks
- 9 quick checks
-
1 Work out [3 marks]
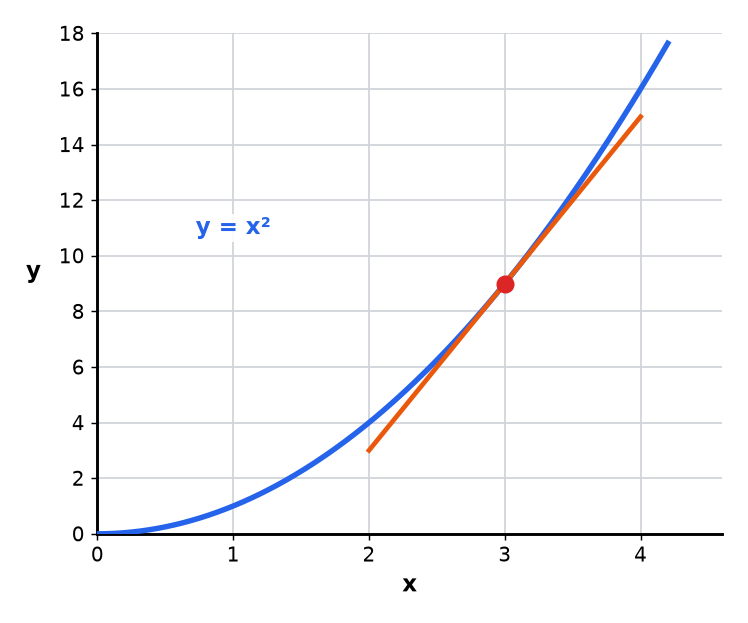
The diagram shows the graph of \(y = x^2\) and the tangent to the curve at the point \((3, 9)\). Work out the gradient of the curve at the point \((3, 9)\). [3 marks]
Show answerHide answer
Model answer
The tangent passes through \((2, 3)\) and \((4, 15)\). Gradient \(= \dfrac{15 - 3}{4 - 2} = 6\).
Mark scheme
- Two points read from the tangent, such as \((2, 3)\) and \((4, 15)\) — M1
- \(\dfrac{15 - 3}{4 - 2}\) — M1
- \(6\) — A1
-
2 Work out [3 marks]
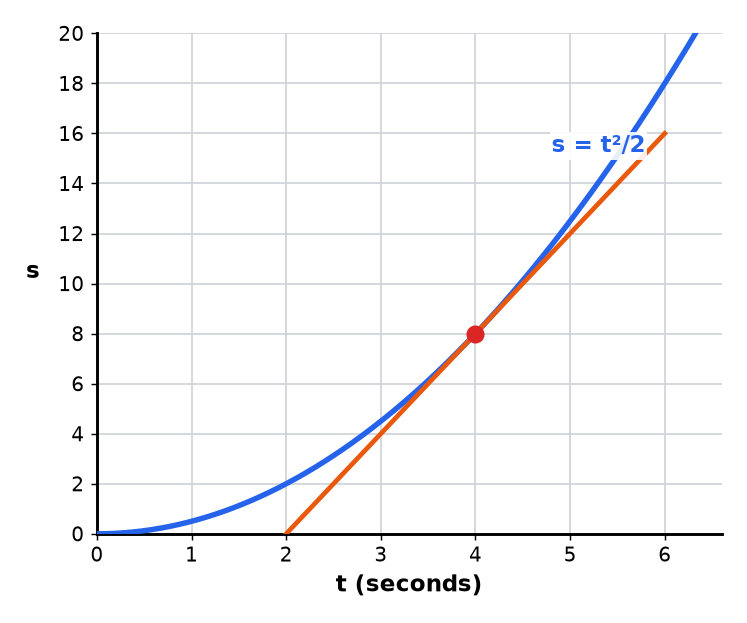
The graph shows the distance, \(s\) metres, travelled by a cyclist after \(t\) seconds. The line is the tangent to the curve at \(t = 4\). Work out the speed of the cyclist at \(t = 4\). [3 marks]
Show answerHide answer
Model answer
The tangent passes through \((2, 0)\) and \((6, 16)\). Gradient \(= \dfrac{16}{4} = 4\), so the speed is 4 m/s.
Mark scheme
- Two points read from the tangent, such as \((2, 0)\) and \((6, 16)\) — M1
- \(\dfrac{16 - 0}{6 - 2}\) — M1
- \(4\) m/s — A1
-
3 Work out [2 marks]
The distance, \(s\) metres, travelled by a car after \(t\) seconds is given by \(s = 2t^2\). Work out the average speed of the car between \(t = 1\) and \(t = 3\). [2 marks]
Show answerHide answer
Model answer
\(s = 2\) when \(t = 1\) and \(s = 18\) when \(t = 3\). Average speed \(= \dfrac{18 - 2}{3 - 1} = 8\) m/s.
Mark scheme
- \(\dfrac{18 - 2}{3 - 1}\) — M1
- \(8\) m/s — A1
-
4 Work out [5 marks]
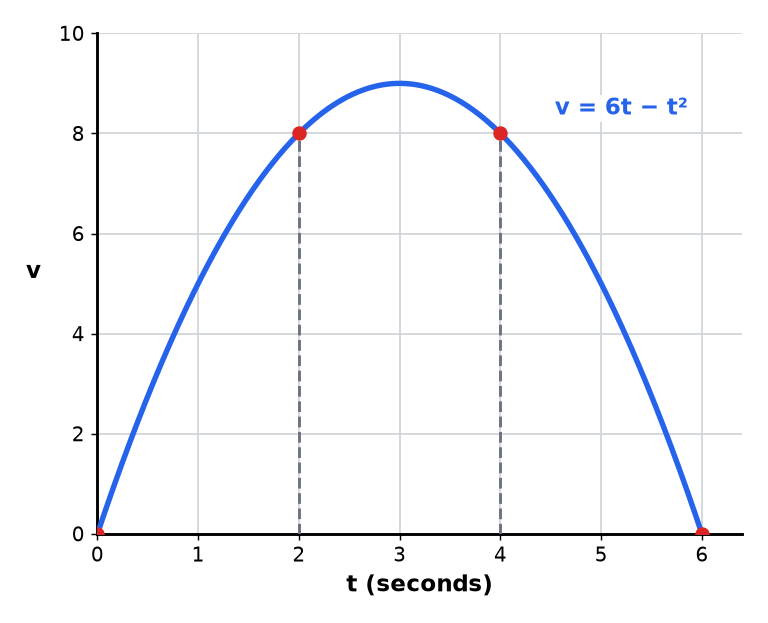
The graph shows the velocity, \(v\) m/s, of a particle at time \(t\) seconds. (a) Use 3 strips of equal width to estimate the distance travelled between \(t = 0\) and \(t = 6\). [3 marks] (b) Is your answer an underestimate or an overestimate? Give a reason for your answer. [2 marks]
Show answerHide answer
Model answer
(a) The heights are 0, 8, 8 and 0. Area \(= \dfrac{1}{2} \times 2 \times (0 + 8) + \dfrac{1}{2} \times 2 \times (8 + 8) + \dfrac{1}{2} \times 2 \times (8 + 0) = 8 + 16 + 8 = 32\) m. (b) An underestimate, because the curve bends downwards and the straight tops of the trapezia are below the curve.
Mark scheme
- (a) Reads the heights 8 and 8 — B1
- (a) Uses \(\dfrac{1}{2}(a + b)h\) for each strip — M1
- (a) \(32\) — A1
- (b) Underestimate — B1
- (b) The curve is above the straight tops of the trapezia — Q1
-
5 Work out [3 marks]
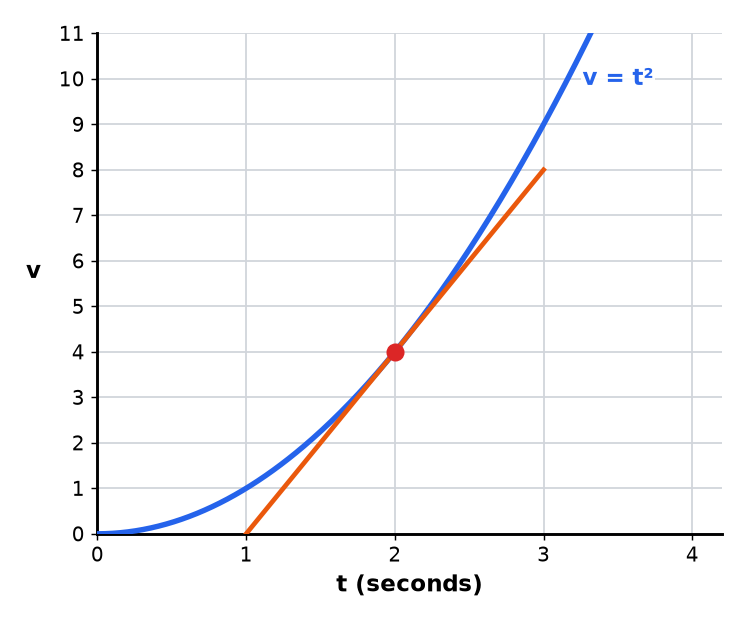
The graph shows the velocity, \(v\) m/s, of a car at time \(t\) seconds. The line is the tangent to the curve at \(t = 2\). Work out an estimate of the acceleration of the car at \(t = 2\). [3 marks]
Show answerHide answer
Model answer
The tangent passes through \((1, 0)\) and \((3, 8)\). Gradient \(= \dfrac{8}{2} = 4\), so the acceleration is 4 m/s\(^2\).
Mark scheme
- Two points read from the tangent, such as \((1, 0)\) and \((3, 8)\) — M1
- \(\dfrac{8 - 0}{3 - 1}\) — M1
- \(4\) m/s\(^2\) — A1
-
6 Work out [4 marks]
The velocity of a particle was measured every second. \(t\) (s): 0, 1, 2, 3, 4 \(v\) (m/s): 0, 2, 6, 12, 20 Use trapezia to estimate the distance travelled in the first 4 seconds. State whether your answer is an underestimate or an overestimate. Give a reason. [4 marks]
Show answerHide answer
Model answer
Area \(= \dfrac{1}{2}(0 + 2) + \dfrac{1}{2}(2 + 6) + \dfrac{1}{2}(6 + 12) + \dfrac{1}{2}(12 + 20) = 1 + 4 + 9 + 16 = 30\) m. It is an overestimate, because the velocity curve bends upwards, so the straight tops of the trapezia are above the curve.
Mark scheme
- \(\dfrac{1}{2}(0 + 2) + \dfrac{1}{2}(2 + 6) + \ldots\), with strips of width 1 — M1
- \(30\) — A1
- Overestimate — B1
- The curve bends upwards, so the straight tops are above the curve — Q1
Quick check
-
1
What do you draw to find the gradient of a curve at a point?
Show answerHide answer
A: A tangent
A tangent touches the curve at that point.
-
2
What is a chord?
Show answerHide answer
D: A straight line joining two points on a curve
The chord joins two points on the curve.
-
3
What does the gradient of a distance-time graph represent?
Show answerHide answer
C: Speed
Distance divided by time is speed.
-
4
What does the area under a velocity-time graph represent?
Show answerHide answer
B: Distance travelled
Velocity multiplied by time is distance.
-
5
A tangent passes through \((1, 0)\) and \((3, 8)\). What is its gradient?
Show answerHide answer
A: 4
\(\dfrac{8 - 0}{3 - 1} = 4\).
-
6
What is the average rate of change of \(y = x^2\) between \(x = 1\) and \(x = 4\)?
Show answerHide answer
D: 5
\(\dfrac{16 - 1}{4 - 1} = 5\).
-
7
What is the area of a trapezium with parallel sides 4 and 6 and width 2?
Show answerHide answer
C: 10
\(\dfrac{1}{2}(4 + 6) \times 2 = 10\).
-
8
A velocity-time curve bends downwards. Is a trapezium estimate of the area an over- or underestimate?
Show answerHide answer
B: An underestimate
The straight tops lie below the curve.
-
9
A velocity-time graph has heights 0, 8, 8, 0 at times 0, 2, 4, 6. What is the trapezium estimate of the distance?
Show answerHide answer
A: 32
\(8 + 16 + 8 = 32\).