Exam questions · Maths · Statistics
Pie Charts, Bar Charts and Stem-and-Leaf Diagrams
- 6 exam questions
- 19 marks
- 9 quick checks
-
1 Work out [3 marks]
Yasmin asks 30 people which fruit they like best. 12 choose apple, 9 choose banana, 6 choose pear and 3 choose grape. She draws a pie chart. Work out the angle for each sector.
Show answerHide answer
Model answer
Each person is \(\dfrac{360}{30} = 12^\circ\). Apple: \(12 \times 12 = 144^\circ\). Banana: \(9 \times 12 = 108^\circ\). Pear: \(6 \times 12 = 72^\circ\). Grape: \(3 \times 12 = 36^\circ\).
Mark scheme
- \(360 \div 30 = 12\) — M1
- At least two angles correct — A1
- \(144^\circ, 108^\circ, 72^\circ, 36^\circ\) — A1
-
2 Work out [4 marks]
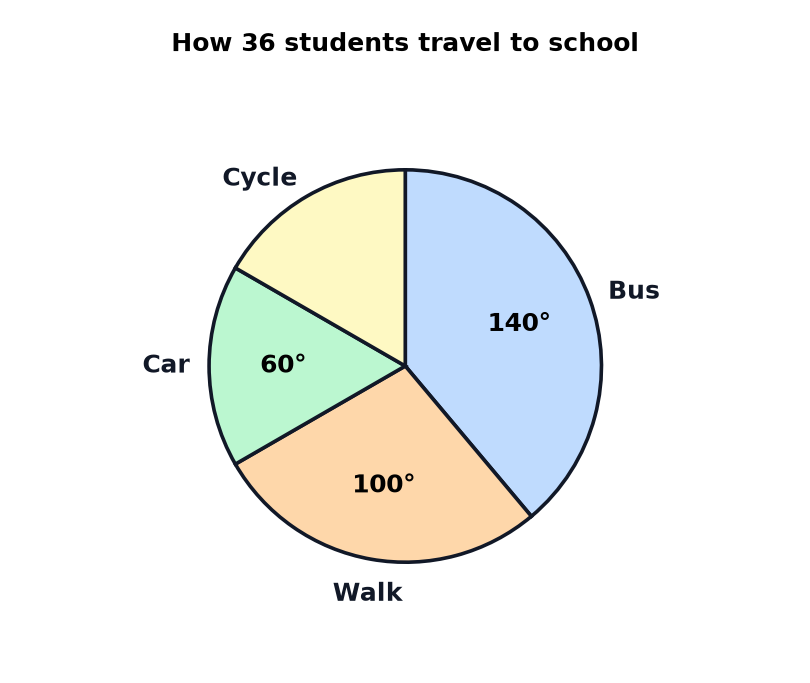
The pie chart shows how 36 students travel to school. The angle for cycle is not shown. (a) Work out how many students walk. (2 marks) (b) Work out the angle for cycle. (1 mark) (c) Work out how many students cycle. (1 mark)
Show answerHide answer
Model answer
(a) Each student is \(\dfrac{360}{36} = 10^\circ\), so the number who walk is \(\dfrac{100}{10} = 10\). (b) \(360 - 140 - 100 - 60 = 60^\circ\). (c) \(\dfrac{60}{10} = 6\).
Mark scheme
- (a) \(\dfrac{100}{360} \times 36\) or \(100 \div 10\) — M1
- (a) 10 — A1
- (b) \(60^\circ\) — B1
- (c) 6 — B1 (follow through from (b))
-
3 Work out [4 marks]
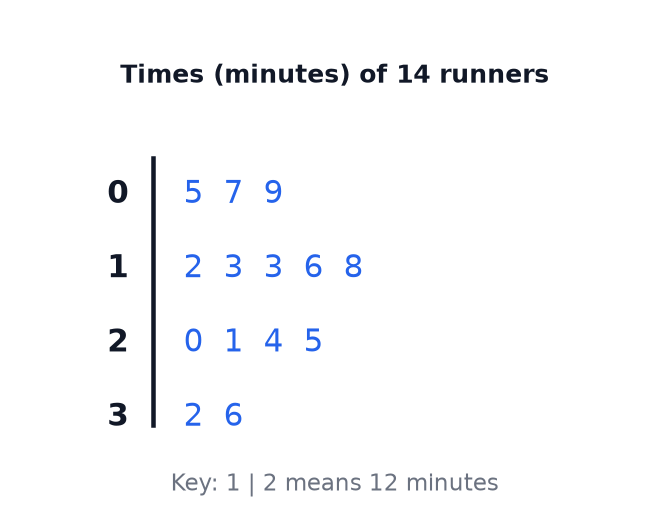
The stem-and-leaf diagram shows the times, in minutes, that 14 runners took to finish a race. (a) Work out the median time. (2 marks) (b) Work out the range of the times. (2 marks)
Show answerHide answer
Model answer
(a) There are 14 values, so the median is halfway between the 7th and 8th values, which are 16 and 18, giving 17 minutes. (b) \(36 - 5 = 31\) minutes.
Mark scheme
- (a) 7th and 8th values 16 and 18 identified — M1
- (a) 17 — A1
- (b) \(36 - 5\) — M1
- (b) 31 — A1
-
4 Explain [2 marks]
A newspaper shows a bar chart of the sales of a phone. The vertical axis starts at 98 instead of 0, and the headline says “Sales soar”. Explain why the chart may be misleading.
Show answerHide answer
Model answer
The vertical axis does not start at zero, so a very small difference in sales looks like a large change.
Mark scheme
- States that the scale does not start at zero — B1
- States that a small difference looks large or exaggerated — B1
-
5 Work out [3 marks]
A stem-and-leaf diagram shows the ages, in years, of some members of a club. The stem 1 has leaves 2, 5 and 8. The stem 2 has leaves 1, 4, 4 and 9. The stem 3 has leaves 0 and 3. The key says that 2 bar 1 means 21 years. For these ages, find (a) the number of members, (b) the median age, (c) the range.
Show answerHide answer
Model answer
(a) \(3 + 4 + 2 = 9\) members. (b) In order the ages are 12, 15, 18, 21, 24, 24, 29, 30, 33, so the 5th value is 24. (c) \(33 - 12 = 21\).
Mark scheme
- (a) 9 — B1
- (b) 24 — B1
- (c) 21 — B1
-
6 Work out [3 marks]
Pie chart A shows the travel to school of 40 students. The angle for cycle is \(90^\circ\). Pie chart B shows the travel to school of 120 students. The angle for cycle is \(60^\circ\). Kim says, “The cycle sector is bigger on chart A, so more students cycle in school A.” Is Kim correct? You must show your working.
Show answerHide answer
Model answer
In school A, \(\dfrac{90}{360} \times 40 = 10\) students cycle. In school B, \(\dfrac{60}{360} \times 120 = 20\) students cycle. Kim is not correct. A bigger fraction cycle in school A, but more students cycle in school B, because there are more students.
Mark scheme
- \(\dfrac{90}{360} \times 40 = 10\) — M1
- \(\dfrac{60}{360} \times 120 = 20\) — M1
- Kim is not correct, with a reason using the totals — C1
Quick check
-
1
60 students choose a sport. 24 choose football. What is the angle for football on a pie chart?
Show answerHide answer
C: \(144^\circ\)
Each student is \(\dfrac{360}{60} = 6^\circ\), so \(24 \times 6 = 144^\circ\).
-
2
A pie chart shows 40 people. How many degrees represent each person?
Show answerHide answer
B: \(9^\circ\)
\(\dfrac{360}{40} = 9\).
-
3
A pie chart shows 36 people. A sector is \(100^\circ\). How many people does it represent?
Show answerHide answer
A: \(10\)
\(\dfrac{100}{360} \times 36 = 10\).
-
4
What fraction of a pie chart is a \(90^\circ\) sector?
Show answerHide answer
D: \(\dfrac{1}{4}\)
\(\dfrac{90}{360} = \dfrac{1}{4}\).
-
5
What must every stem-and-leaf diagram have?
Show answerHide answer
C: A key
Without a key the values cannot be read.
-
6
A stem-and-leaf diagram has 14 ordered values. The 7th is 26 and the 8th is 29. What is the median?
Show answerHide answer
B: \(27.5\)
\(\dfrac{26 + 29}{2} = 27.5\).
-
7
The values in a stem-and-leaf diagram run from 12 to 45. What is the range?
Show answerHide answer
A: \(33\)
\(45 - 12 = 33\).
-
8
Which of these makes a bar chart misleading?
Show answerHide answer
D: The vertical scale does not start at zero
A scale that does not start at zero exaggerates differences.
-
9
On a pie chart for 60 people, a sector is \(54^\circ\). What percentage is that?
Show answerHide answer
C: \(15\%\)
\(\dfrac{54}{360} = 0.15\).