Maths · Statistics
Viewing as
Teaching this? The teacher view opens every answer and mark scheme.
Averages and Range
Finding the mean, median, mode and range, using frequency tables and grouped data, and choosing the best average.
Learning Objectives
- 1Calculate the mean, median, mode and range of a small data set.
- 2Choose the most suitable average and explain the effect of an outlier.
- 3Find the mean, median and mode from a frequency table.
- 4Estimate the mean from grouped data using mid-points, and find the modal class and median class.
One number to describe the data
An average gives one value that stands for a whole set of data, and the range tells you how spread out the data is. Statistics questions on a non-calculator paper use small sets of numbers, so you need to be accurate rather than fast: write the numbers in order, show your adding up, and always say what the answer means. Frequency tables are where many marks are lost, because the mean needs the frequency multiplied by the value, not just the values added up.
Mean, median, mode and range
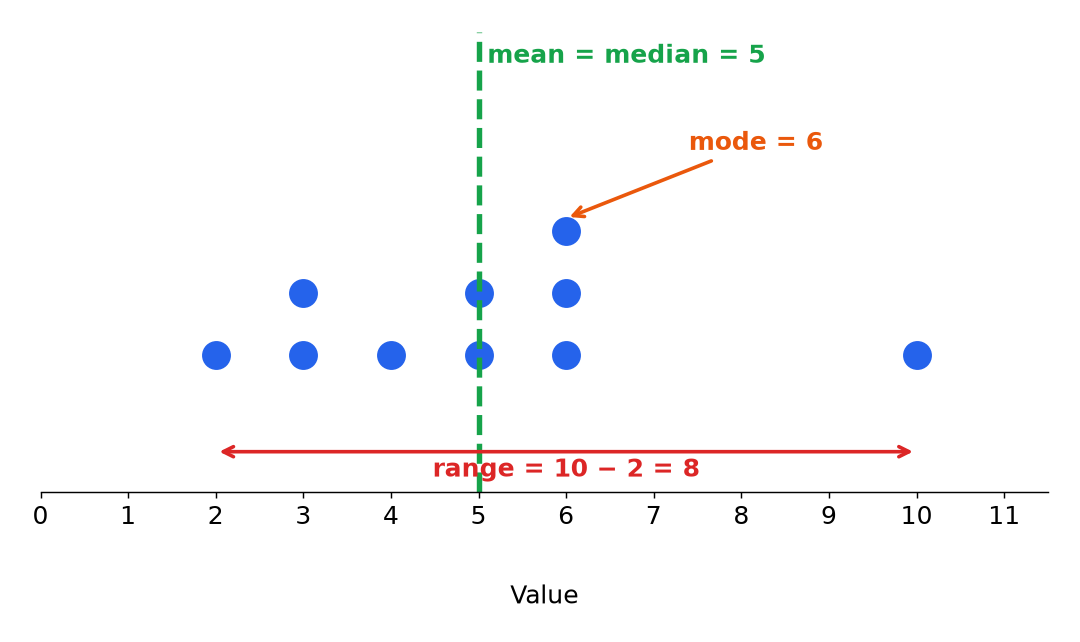
The three averages are different ways of finding a typical value. The data here is 2, 3, 3, 4, 5, 5, 6, 6, 6, 10, which gives a mean of 5, a median of 5 and a mode of 6.
The measures
- Mean Add all the values and divide by how many there are: \(\dfrac{50}{10} = 5\).
- Median The middle value of the ordered data. With 10 values, take the average of the 5th and 6th: \(\dfrac{5 + 5}{2} = 5\).
- Mode The most common value, which is 6 here.
- Range Largest minus smallest: \(10 - 2 = 8\).
Choosing an average
Each average has strengths and weaknesses, and exam questions often ask you to choose one.
-
Mean
Uses every value, but one extreme value, an outlier, can pull it up or down.
-
Median
Not affected by outliers, so it is best when there are some very large or very small values.
-
Mode
The only average for non-numerical data, such as the most popular colour, but it may not exist or may not be unique.
-
Range
A measure of spread, not an average. A smaller range means the data is more consistent.
Comparing with a mean and range
Sam's five test scores are 12, 15, 15, 18, 20. Tina's five test scores are 8, 14, 15, 20, 23. Compare their scores using the mean and the range.
Show the solutionHide the solution
- 1 Sam's mean \(\dfrac{12 + 15 + 15 + 18 + 20}{5} = \dfrac{80}{5} = 16\).
- 2 Tina's mean \(\dfrac{8 + 14 + 15 + 20 + 23}{5} = \dfrac{80}{5} = 16\).
- 3 Ranges Sam: \(20 - 12 = 8\). Tina: \(23 - 8 = 15\).
- 4 Conclusion The means are equal, so on average they score the same, but Sam's smaller range shows more consistent scores.
AnswerBoth have a mean of 16, but Sam's range of 8 is smaller than Tina's 15, so Sam is more consistent
Frequency tables
When values are repeated, a frequency table saves writing them all out, but the method changes.
-
Mean
Multiply each value by its frequency, add up the products, and divide by the total frequency. \(\bar{x} = \dfrac{\sum fx}{\sum f}\).
-
Median
The total frequency is \(n\), so the median is the \(\dfrac{n + 1}{2}\)th value. Use the cumulative frequencies to find which value that is.
-
Mode
The value with the highest frequency.
-
Range
Largest value minus smallest value, not the largest frequency.
Mean from a frequency table
The table shows the number of pets owned by 20 students. Pets 0, 1, 2, 3, 4 have frequencies 4, 4, 6, 4, 2. Work out the mean, median and mode.
Show the solutionHide the solution
- 1 Products \(0 \times 4 = 0\), \(1 \times 4 = 4\), \(2 \times 6 = 12\), \(3 \times 4 = 12\), \(4 \times 2 = 8\), which add up to 36.
- 2 Mean \(\dfrac{36}{20} = 1.8\).
- 3 Median There are 20 values, so the median is halfway between the 10th and 11th. Cumulative frequencies are 4, 8, 14, 18, 20, so the 10th and 11th are both 2, and the median is 2.
- 4 Mode The highest frequency is 6, for 2 pets, so the mode is 2.
AnswerMean 1.8, median 2, mode 2
Grouped data
When data is in groups, you do not know the exact values, so you estimate.
-
Mid-points
Use the middle of each class as its value. For \(20 < w \leq 40\) the mid-point is 30.
-
Estimated mean
Multiply each mid-point by its frequency, add up, and divide by the total frequency.
-
Modal class
The class with the highest frequency.
-
Median class
The class that contains the middle value, found with the cumulative frequency.
Estimating a mean from grouped data
The weights of 20 parcels are 5 in the class \(0 < w \leq 20\), 10 in \(20 < w \leq 40\) and 5 in \(40 < w \leq 60\). Estimate the mean weight.
Show the solutionHide the solution
- 1 Mid-points 10, 30 and 50.
- 2 Products \(10 \times 5 = 50\), \(30 \times 10 = 300\) and \(50 \times 5 = 250\).
- 3 Total \(50 + 300 + 250 = 600\).
- 4 Estimated mean \(\dfrac{600}{20} = 30\) kg. It is only an estimate, because the true values are not known.
Answer30 kg
Working backwards from a mean
The total is the mean times the number of values.
-
Total from a mean
If 5 numbers have a mean of 8, they total \(5 \times 8 = 40\).
-
Adding a value
Adding a sixth number to give a mean of 9 means the new total is \(6 \times 9 = 54\), so the new number is \(54 - 40 = 14\).
-
Combined means
To combine groups, find each total, add the totals, and divide by all the values.
-
Missing value
A set with a known mean and known values leaves the missing value as total minus the others.
Test yourself
-
1
How do you find the median of 10 ordered values?
Show answerHide answer
The mean of the 5th and 6th.
-
2
What is the range of 3, 8, 11, 20?
Show answerHide answer
\(20 - 3 = 17\).
-
3
How do you find the mean from a frequency table?
Show answerHide answer
Divide the total of frequency times value by the total frequency.
-
4
Which average is least affected by an outlier?
Show answerHide answer
The median.
-
5
What is the mid-point of the class \(10 < t \leq 20\)?
Show answerHide answer
15.
Exam technique: averages
Show the working, and say what the answer means.
-
Order the data
Write the values in order before finding the median.
-
Show the products
In a frequency table, show each \(f \times x\) separately.
-
Give a conclusion
"On average" and "more consistent" are needed in comparison questions.
-
Compare like with like
Compare an average with an average, and a range with a range.
Summary and exam focus
- The mean, median and mode are averages, and the range is a measure of spread.
- The median is not affected by outliers, and a smaller range means more consistent data.
- With a frequency table, the mean is \(\dfrac{\sum fx}{\sum f}\), and the median is the \(\dfrac{n + 1}{2}\)th value.
- For grouped data use mid-points to estimate the mean.
Exam focus
The mean of five numbers is 8. Four of the numbers are 5, 7, 9 and 10. Work out the fifth number. (2 marks) (2 marks)
The total of five numbers with a mean of 8 is \(5 \times 8 = 40\). The four known numbers add up to 31, so the fifth number is \(40 - 31 = 9\). Do not average the four known numbers.
Key terms
The words this lesson expects you to use. Each one is linked from the first place it appears above.
- Mean
- The sum of the values divided by how many there are.
- Median
- The middle value when the data is in order.
- Mode
- The value that occurs most often.
- Range
- The difference between the largest and smallest values.
- Outlier
- A value that is much larger or smaller than the others.
- Frequency table
- A table showing how often each value occurs.
- Grouped data
- Data sorted into classes, such as \(0 < t \leq 10\).
- Mid-point
- The middle value of a class, used to estimate the mean of grouped data.
- Modal class
- The class with the highest frequency.
You've finished the notes
Check your understanding
Test yourself while it is fresh. Start with the flashcards, then try the exam questions.
Something here looks wrong?
Tell us what and we will go and look. It goes to whoever writes these pages, nobody else, and we do not ask who you are — so there is nothing to sign and nothing comes back to you.