Maths · Probability
Knowledge organiser
The whole chapter on one page. Print it on A4 — it is already landscape — or cover a box and see how much of it you can say from memory.
Maths · Edexcel Paper 2
Probability
Probability Basics and Relative Frequency
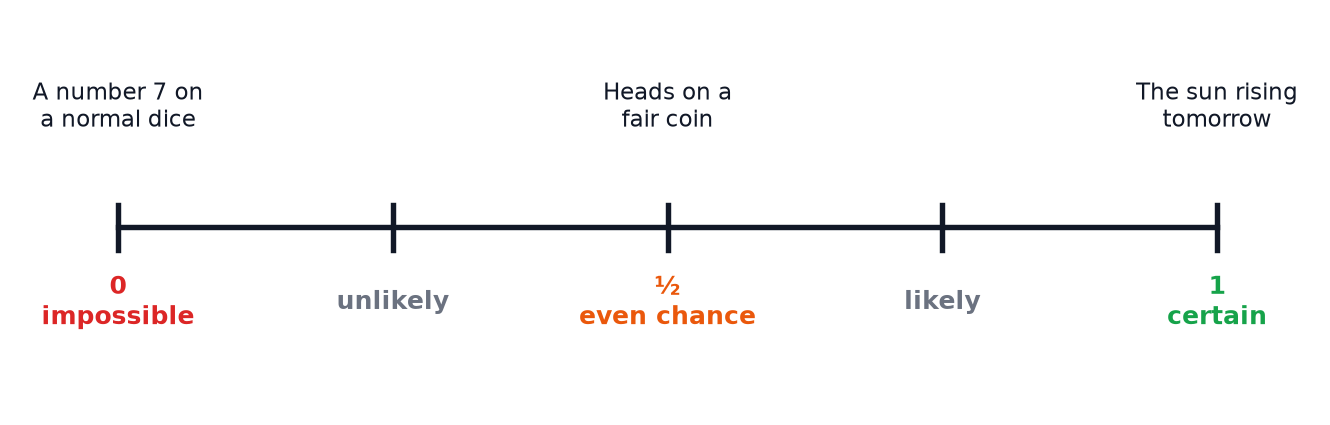
Calculating simple probabilities, using the probability scale, and estimating from relative frequency and expected outcomes.
- Probability A number from 0 to 1 that measures how likely an event is.
- Outcome One possible result of an experiment.
- Event One or more outcomes that you are interested in.
Tree Diagrams
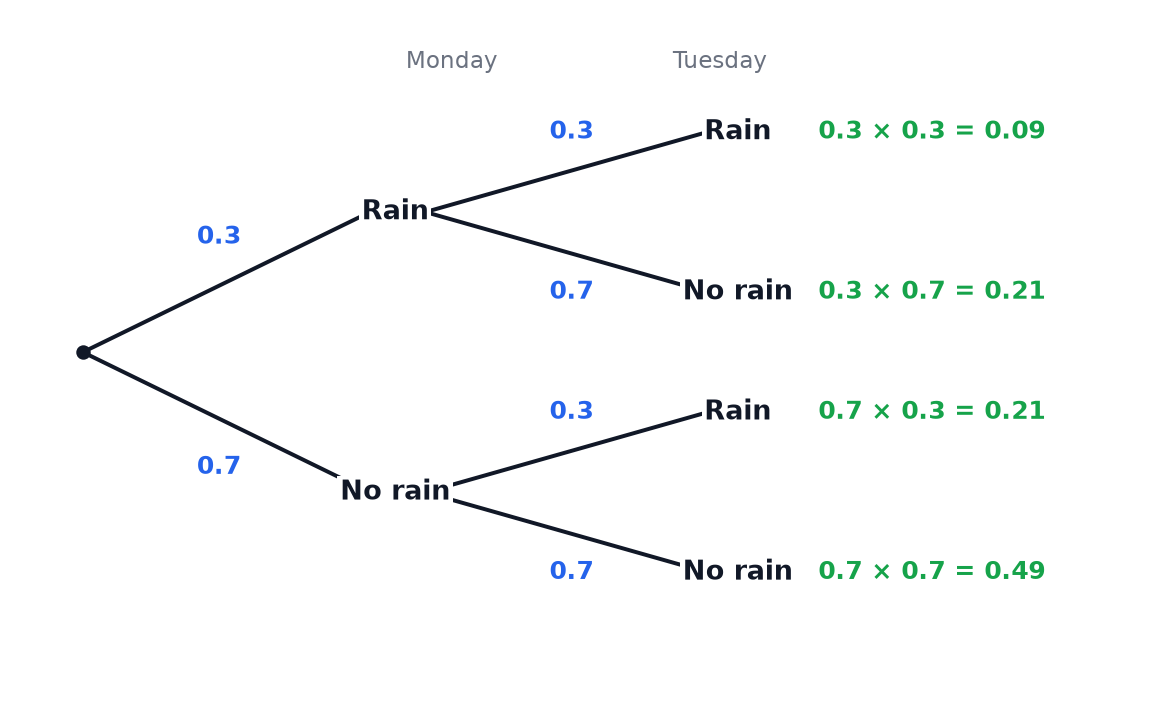
Combining independent and dependent events with tree diagrams, with and without replacement.
- Tree diagram A diagram with branches that shows the outcomes of events in order and their probabilities.
- Branch A line on a tree diagram showing one possible outcome and its probability.
- Independent events Events where one does not affect the probability of the other.
Venn Diagrams and Set Notation
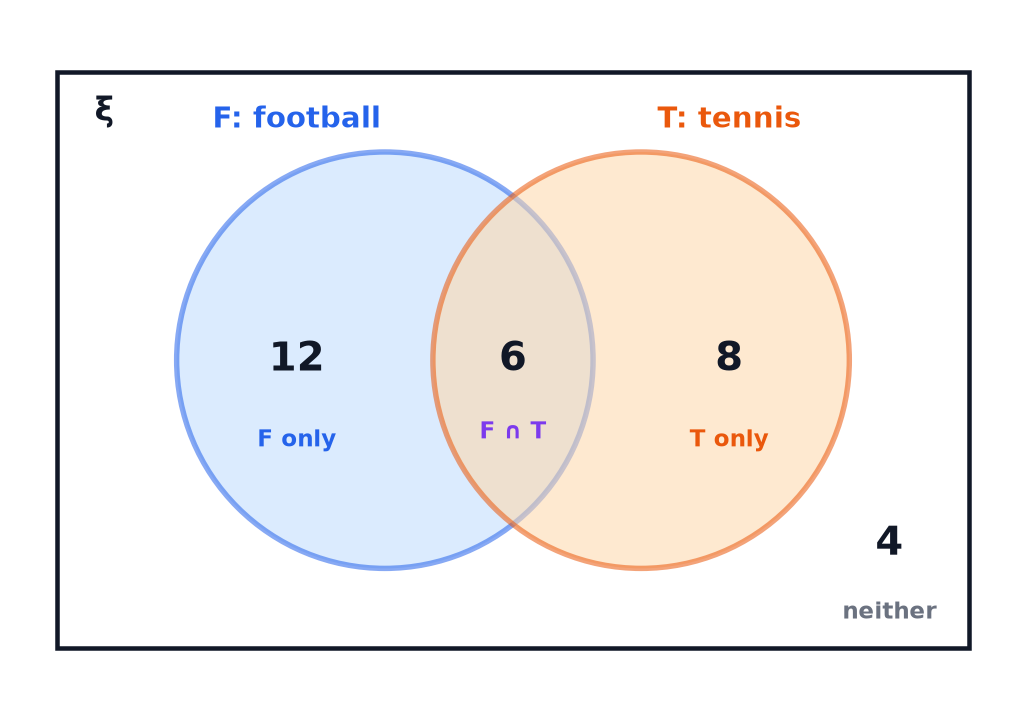
Using sets, Venn diagrams and set notation to organise data and find probabilities.
- Set A collection of items, written in curly brackets.
- Universal set The set of everything being considered, written \xi.
- Intersection The items in both sets, written A \cap B.
Frequency Trees and Two-Way Tables
Completing frequency trees and two-way tables and using them to find probabilities.
- Two-way table A table that shows how many items have each combination of two features.
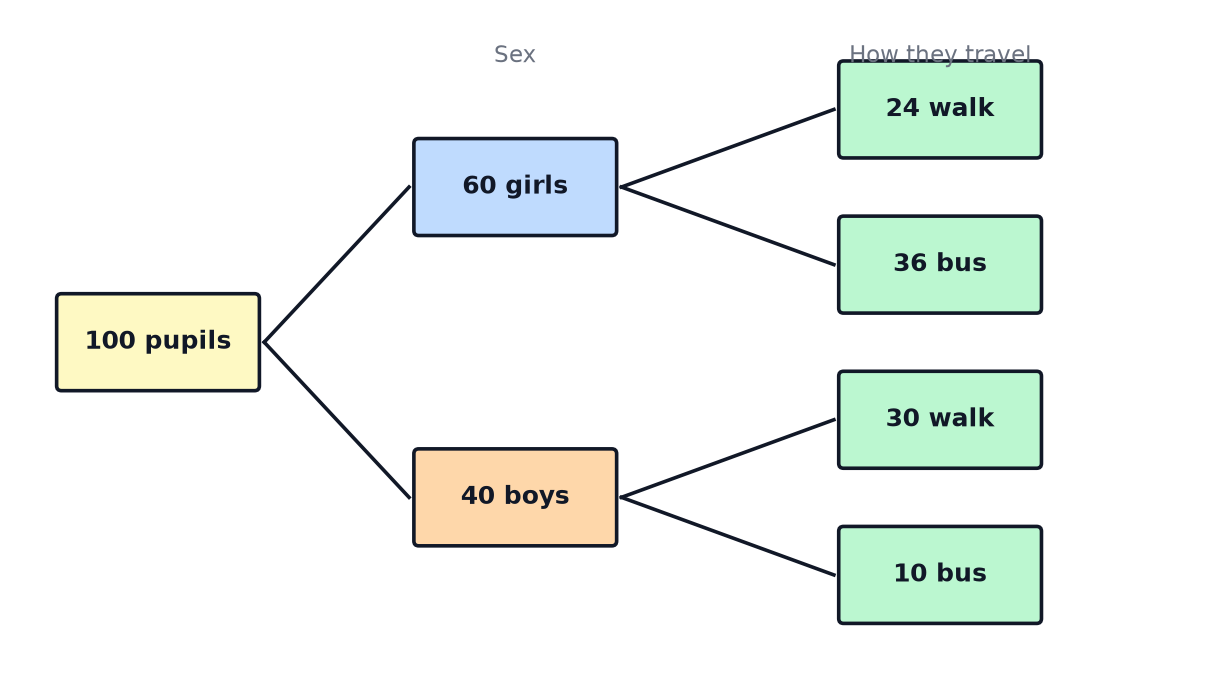
- Frequency tree A tree diagram with the number of items on each branch.
- Frequency The number of times something happens or the number of items in a group.
Conditional Probability (Higher tier)
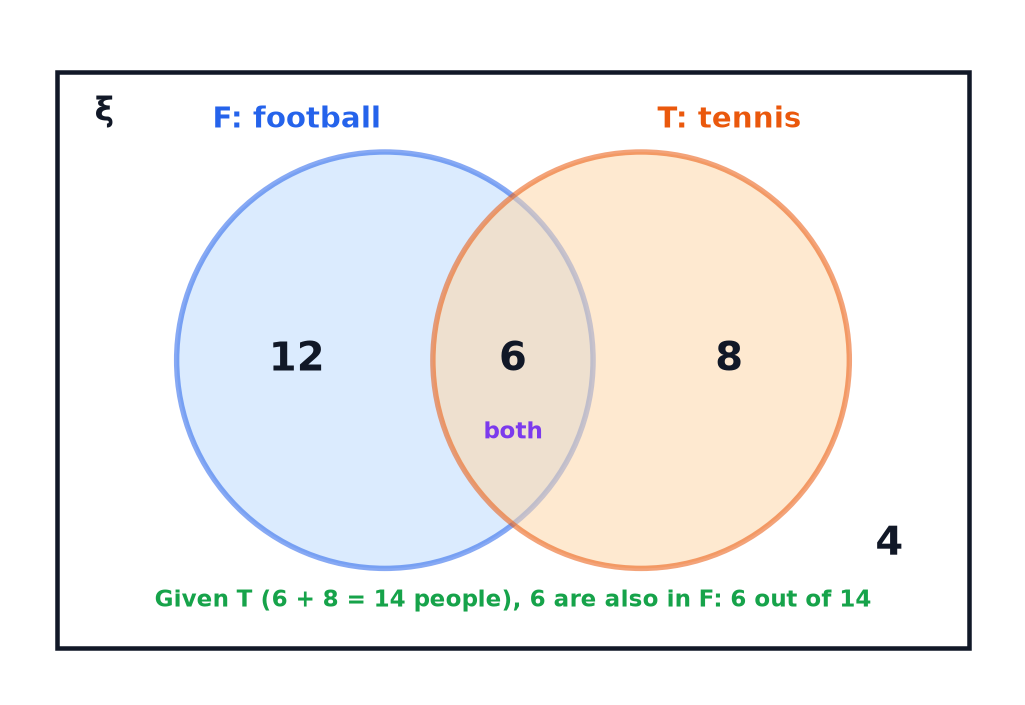
Finding probabilities given that something has already happened, from tables, Venn diagrams and tree diagrams.
- Conditional probability The probability of an event given that another event has happened.
- Given that The words that mean you only look at part of the group.
- Independent Events where knowing one has no effect on the probability of the other.