Maths · Graphs
Knowledge organiser
The whole chapter on one page. Print it on A4 — it is already landscape — or cover a box and see how much of it you can say from memory.
Maths · OCR Paper 2
Graphs
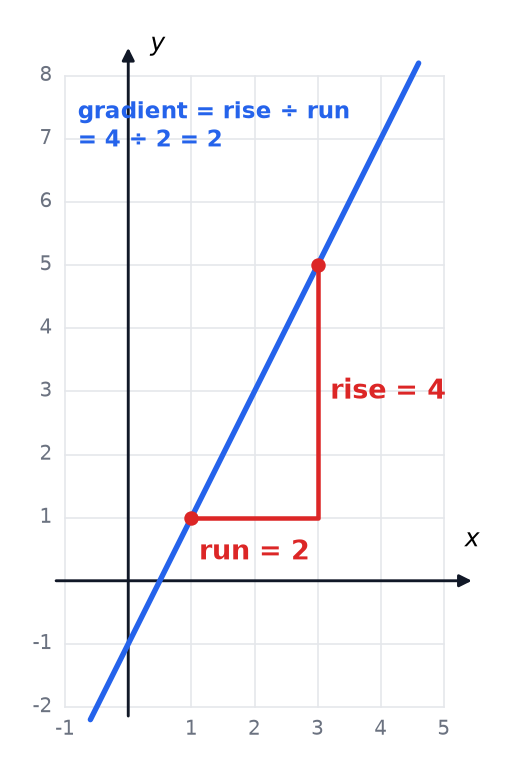
Straight-Line Graphs
Plotting lines, finding gradients, and reading the gradient and intercept from y = mx + c.
- Coordinates A pair of numbers (x, y) that give the position of a point on a grid.
- Gradient A measure of how steep a line is, found by dividing the change in y by the change in x.
- Intercept The point where a line crosses an axis.
Equations of Straight Lines
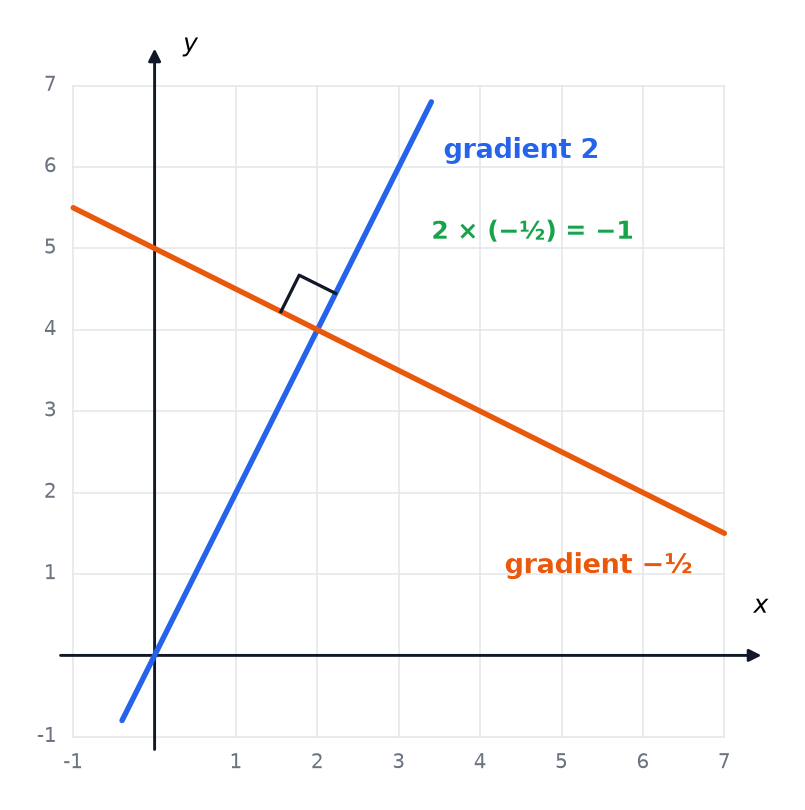
Finding the equation of a line from two points, midpoints, and parallel and perpendicular lines.
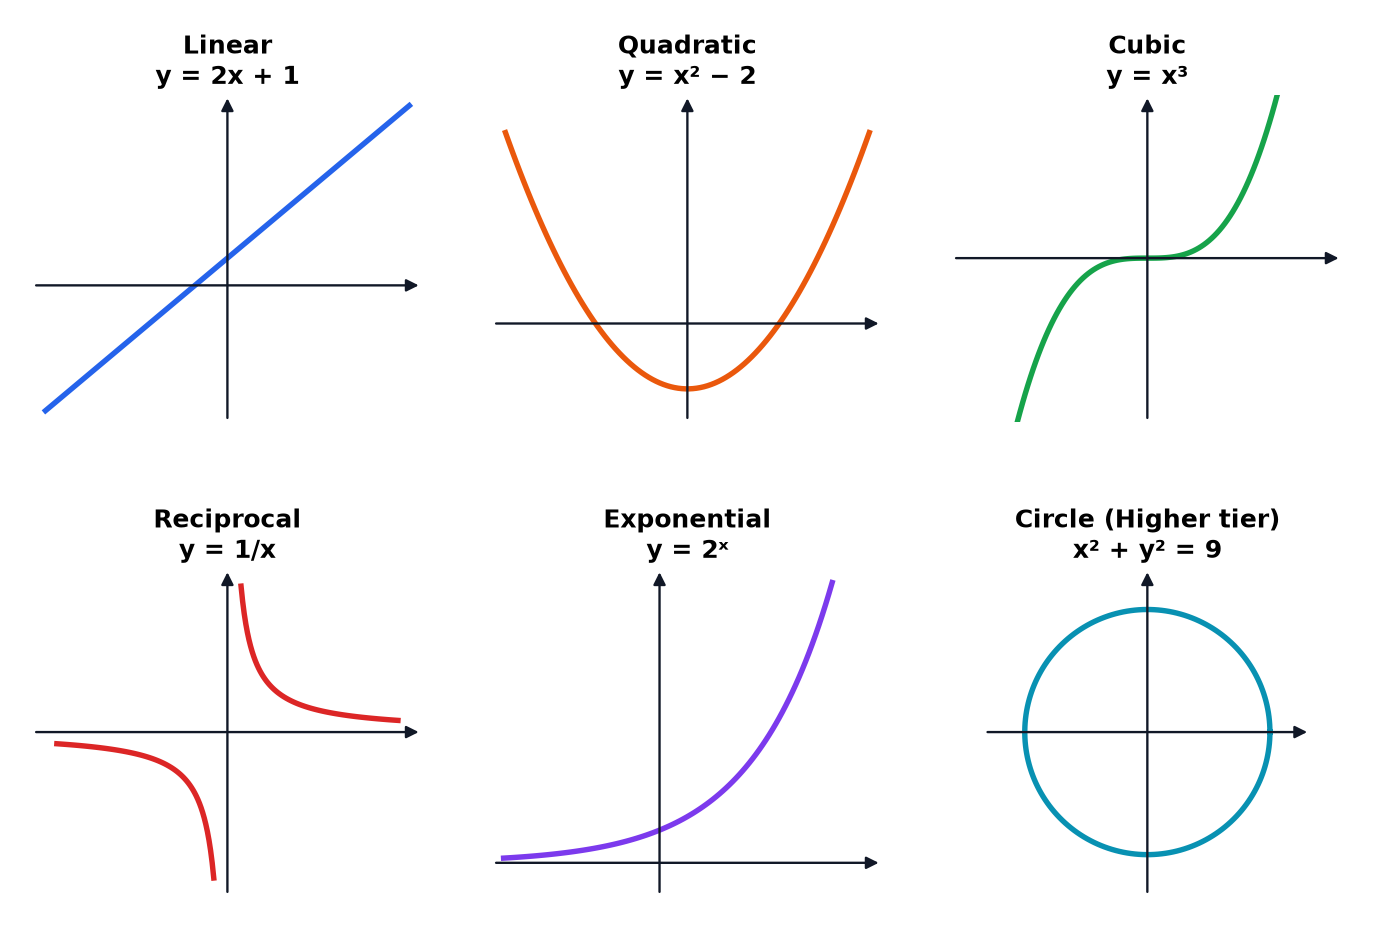
- Equation of a line A rule such as y = 2x + 1 that is true for every point on the line.
- Midpoint The point halfway along a line segment.
- Line segment The part of a line between two end points.
Quadratic Graphs
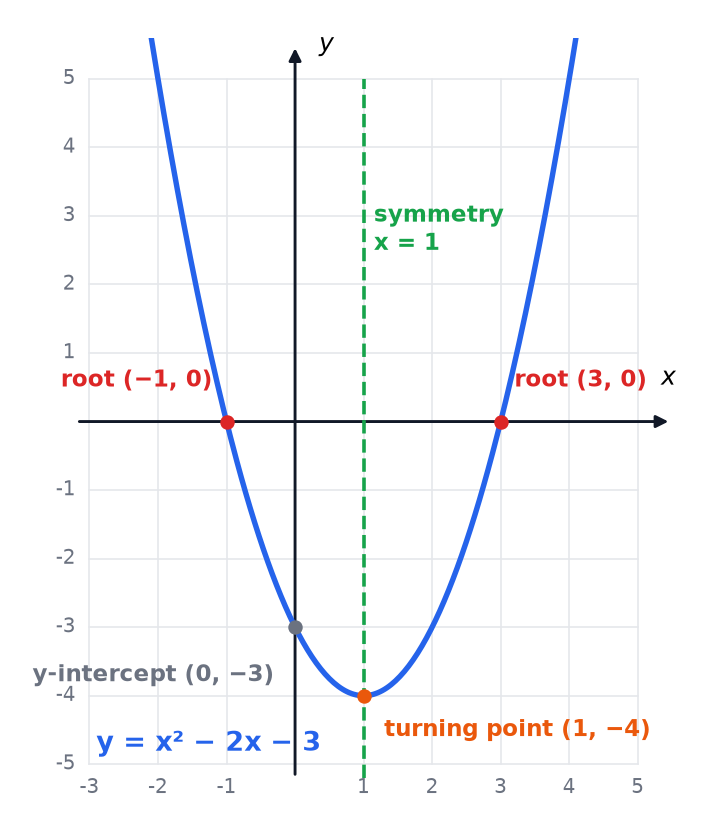
Plotting quadratics and using the roots, turning point and line of symmetry to read and solve.
- Quadratic An expression or equation whose highest power of x is x^2.
- Parabola The smooth U-shaped curve that is the graph of a quadratic.
- Root A value of x where a graph crosses the x-axis, so y = 0.
Cubic, Reciprocal and Other Graphs
Recognising and plotting cubic, reciprocal, exponential and circle graphs.
- Cubic An equation whose highest power of x is x^3, with an S-shaped graph.
- Reciprocal One divided by a number or expression, such as \dfrac{1}{x}.
- Exponential A relationship where the unknown is in the power, such as y = 2^x.
Real-Life Graphs
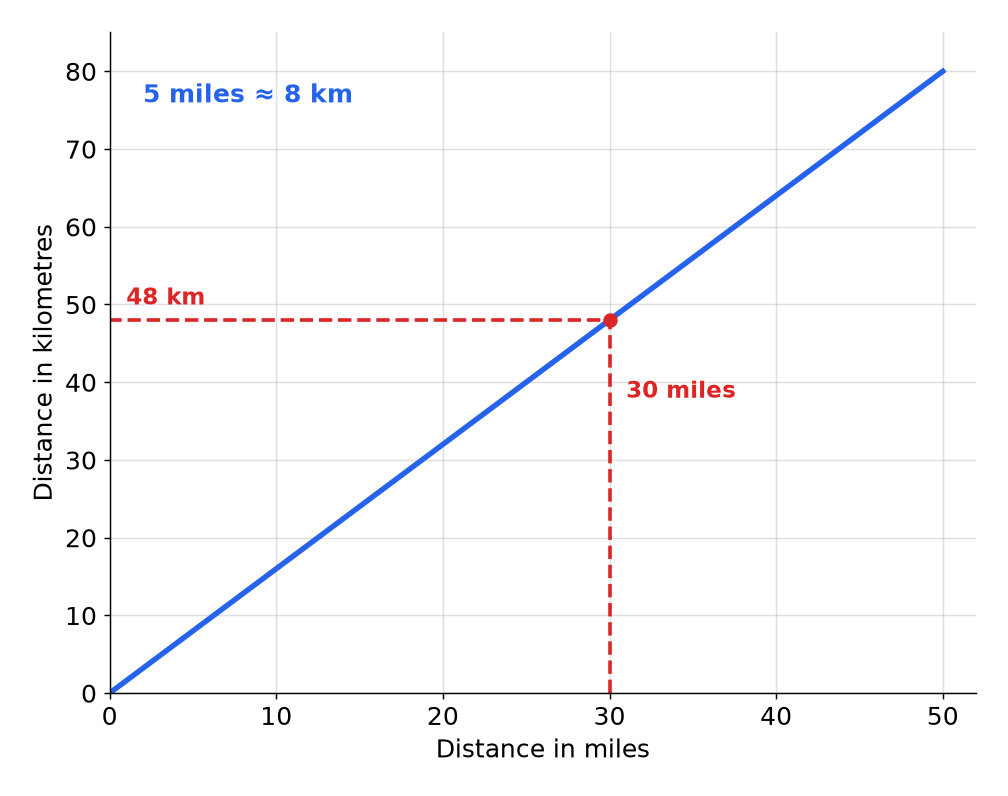
Conversion graphs, filling containers and velocity-time graphs: gradient as rate and area as distance.
- Conversion graph A graph for changing between two units, such as miles and kilometres.
- Rate of change How quickly one quantity changes compared with another.
- Acceleration The rate at which velocity changes, in metres per second per second.