Exam questions · Maths · Statistics
Scatter Graphs
- 6 exam questions
- 19 marks
- 9 quick checks
-
1 Write down [2 marks]
Write down the type of correlation between (a) the age of a car and its value, (b) the heights of children and their ages. [2 marks]
Show answerHide answer
Model answer
(a) Negative correlation. (b) Positive correlation.
Mark scheme
- (a) Negative — B1
- (b) Positive — B1
-
2 Estimate [5 marks]
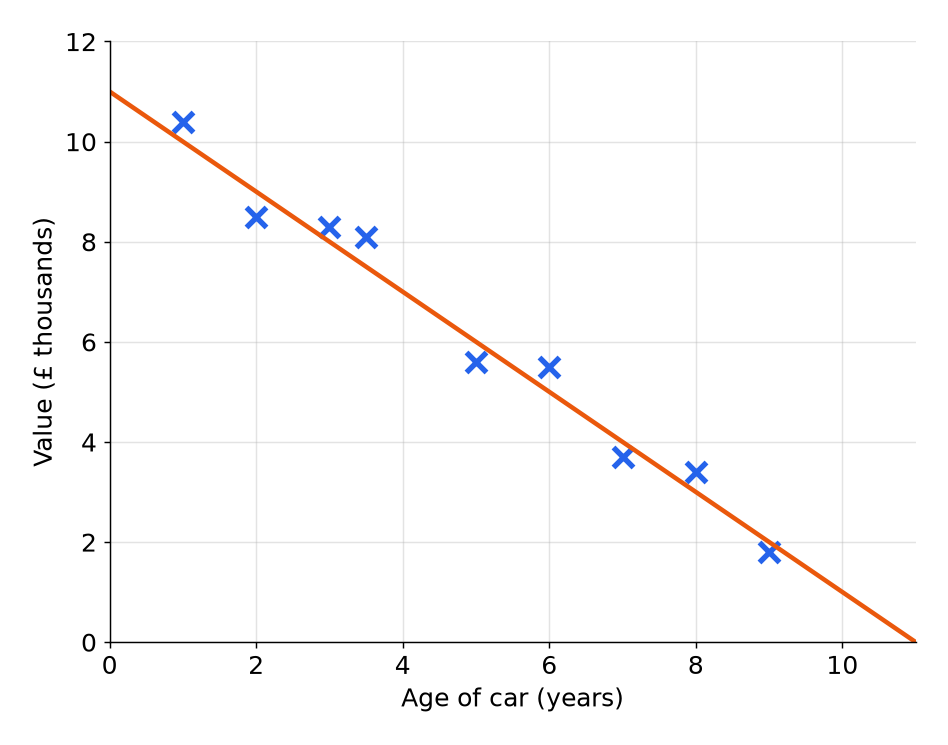
The scatter graph shows the age and the value of some cars. A line of best fit is drawn. (a) Describe the relationship between the age of a car and its value. [1 mark] (b) Use the line of best fit to estimate the value of a car that is 4 years old. [2 marks] (c) Dev says that the line can be used to estimate the value of a car that is 12 years old. Explain why this is not sensible. [2 marks]
Show answerHide answer
Model answer
(a) As the age of a car increases, its value decreases. (b) Going up from 4 years to the line and across gives about 7, which is \(\pounds 7000\). (c) 12 years is outside the range of the data. The line would give a negative value, \(11 - 12 = -1\), which is impossible.
Mark scheme
- (a) As the age increases, the value decreases — B1
- (b) A line drawn up from 4 to the line of best fit and across — M1
- (b) \(\pounds 7000\) (accept \(\pounds 6800\) to \(\pounds 7200\)) — A1
- (c) 12 years is outside the range of the data — B1
- (c) The line would give a negative value — B1
-
3 Work out [3 marks]
A line of best fit for the hours of practice, \(x\), and the number of goals scored, \(y\), has the equation \(y = 0.5x + 4\). (a) Use the equation to estimate the number of goals for 10 hours of practice. [1 mark] (b) What does the number 0.5 represent? [1 mark] (c) Explain why the equation should not be used for 100 hours of practice. [1 mark]
Show answerHide answer
Model answer
(a) \(0.5 \times 10 + 4 = 9\). (b) For each extra hour of practice there are 0.5 more goals. (c) 100 hours is far outside the range of the data, and the pattern may not continue.
Mark scheme
- (a) 9 — B1
- (b) 0.5 more goals for each extra hour — B1
- (c) Outside the range of the data, so not reliable — B1
-
4 Explain [2 marks]
There is a positive correlation between the shoe size and the reading ability of primary school children. Does having bigger feet make a child a better reader? Give a reason for your answer. [2 marks]
Show answerHide answer
Model answer
No. Both shoe size and reading ability increase as a child gets older, so age explains both. Correlation does not mean that one thing causes the other.
Mark scheme
- No — B1
- A reason such as age affecting both — B1
-
5 Work out [3 marks]
A line of best fit on a scatter graph goes through \((0, 8)\) and \((10, 0)\). (a) Write down the type of correlation. [1 mark] (b) Use the line to estimate \(y\) when \(x = 5\). [2 marks]
Show answerHide answer
Model answer
(a) Negative correlation, because the line slopes downwards. (b) The line is halfway between \(x = 0\) and \(x = 10\) at \(x = 5\), so \(y\) is halfway between 8 and 0, which is 4.
Mark scheme
- (a) Negative — B1
- (b) Uses the gradient \(-0.8\) or the midpoint of the line — M1
- (b) 4 — A1
-
6 Work out [4 marks]
A line of best fit goes through the points \((4, 5)\) and \((12, 25)\). (a) Work out the gradient of the line. [2 marks] (b) Use the line to estimate \(y\) when \(x = 8\). [2 marks]
Show answerHide answer
Model answer
(a) \(\dfrac{25 - 5}{12 - 4} = \dfrac{20}{8} = 2.5\). (b) \(y = 2.5x - 5\), so when \(x = 8\), \(y = 2.5 \times 8 - 5 = 15\). Alternatively, \(x = 8\) is halfway between 4 and 12, so \(y\) is halfway between 5 and 25.
Mark scheme
- (a) \(\dfrac{20}{8}\) — M1
- (a) 2.5 — A1
- (b) \(y = 2.5x - 5\) or the midpoint — M1
- (b) 15 — A1
Quick check
-
1
What type of correlation has points sloping downwards from left to right?
Show answerHide answer
D: Negative
One variable falls as the other rises.
-
2
Which statement describes positive correlation?
Show answerHide answer
C: As one variable increases, the other increases
Positive correlation slopes upwards.
-
3
What is an outlier?
Show answerHide answer
B: A point that does not fit the pattern of the others
Outliers are far from the trend.
-
4
A line of best fit has equation \(y = 4x + 8\). Estimate \(y\) when \(x = 12\).
Show answerHide answer
A: \(56\)
\(4 \times 12 + 8 = 56\).
-
5
Data runs from 2 to 16 hours of revision. What do we call an estimate for 25 hours?
Show answerHide answer
D: Extrapolation
Outside the range of the data is extrapolation.
-
6
Which estimate is likely to be more reliable?
Show answerHide answer
C: One inside the range of the data
Interpolation is more reliable than extrapolation.
-
7
Ice cream sales and sunburn are positively correlated. What is the best explanation?
Show answerHide answer
B: Hot weather increases both
A third factor can cause both.
-
8
The line of best fit is \(y = 4x + 8\), where \(x\) is hours of revision and \(y\) is the test score. What does the gradient mean?
Show answerHide answer
A: Each extra hour of revision adds about 4 marks
The gradient is the change in score for each extra hour.
-
9
In \(y = 4x + 8\), what does 8 represent?
Show answerHide answer
D: The estimated score with no revision
It is the \(y\)-intercept, the value when \(x = 0\).