Slides · PPTX · 278 KB · 29 slides
Cumulative frequency - Teacher Slides.pptx
The lesson slides with the teacher's notes on each slide, and every question and mark scheme built in. Built from the lesson script on 30 September 2026.
EDEXCEL GCSE MATHS · FOUNDATION & HIGHER
Cumulative frequency
Further statistics
Lesson 2 of 6
openrevise.com
EDEXCEL GCSE MATHS · FOUNDATION & HIGHER
Warm-up
Further statistics
Lesson 2 of 6
Answer each one, then check.
1
What is the median?
2
What is the range?
3
Running total of 4, 11, 20?
4
What is a grouped frequency table?
5
Write the class 20 < t ≤ 30 in words.
openrevise.com
EDEXCEL GCSE MATHS · FOUNDATION & HIGHER
Warm-up - Answers
Further statistics
Lesson 2 of 6
1
What is the median?
The middle value when the data are in order
2
What is the range?
Largest minus smallest
3
Running total of 4, 11, 20?
4, 15, 35
4
What is a grouped frequency table?
A table showing how many values fall in each class
5
Write the class 20 < t ≤ 30 in words.
More than 20 and up to and including 30
openrevise.com
EDEXCEL GCSE MATHS · FOUNDATION & HIGHER
Learning Objectives
Further statistics
Lesson 2 of 6
1
Work out cumulative frequencies from a grouped table.
2
Plot a cumulative frequency graph.
3
Estimate the median, lower quartile and upper quartile.
4
Find the interquartile range and answer questions from the graph.
openrevise.com
EDEXCEL GCSE MATHS · FOUNDATION & HIGHER
Further statistics
Lesson 2 of 6
CUMULATIVE FREQUENCY
Cumulative frequency is a running total of the frequencies. Plot each total against the upper class boundary.
Points are joined with a smooth curve that always rises.
openrevise.com
EDEXCEL GCSE MATHS · FOUNDATION & HIGHER
Building the Table
Further statistics
Lesson 2 of 6
Time taken (t minutes) to complete a puzzle, 60 students.
Time
Frequency
Cumulative frequency
0 < t ≤ 10
4
4
10 < t ≤ 20
11
15
20 < t ≤ 30
20
35
30 < t ≤ 40
16
51
40 < t ≤ 50
7
58
50 < t ≤ 60
2
60
openrevise.com
EDEXCEL GCSE MATHS · FOUNDATION & HIGHER
Reading the Curve
Further statistics
Lesson 2 of 6

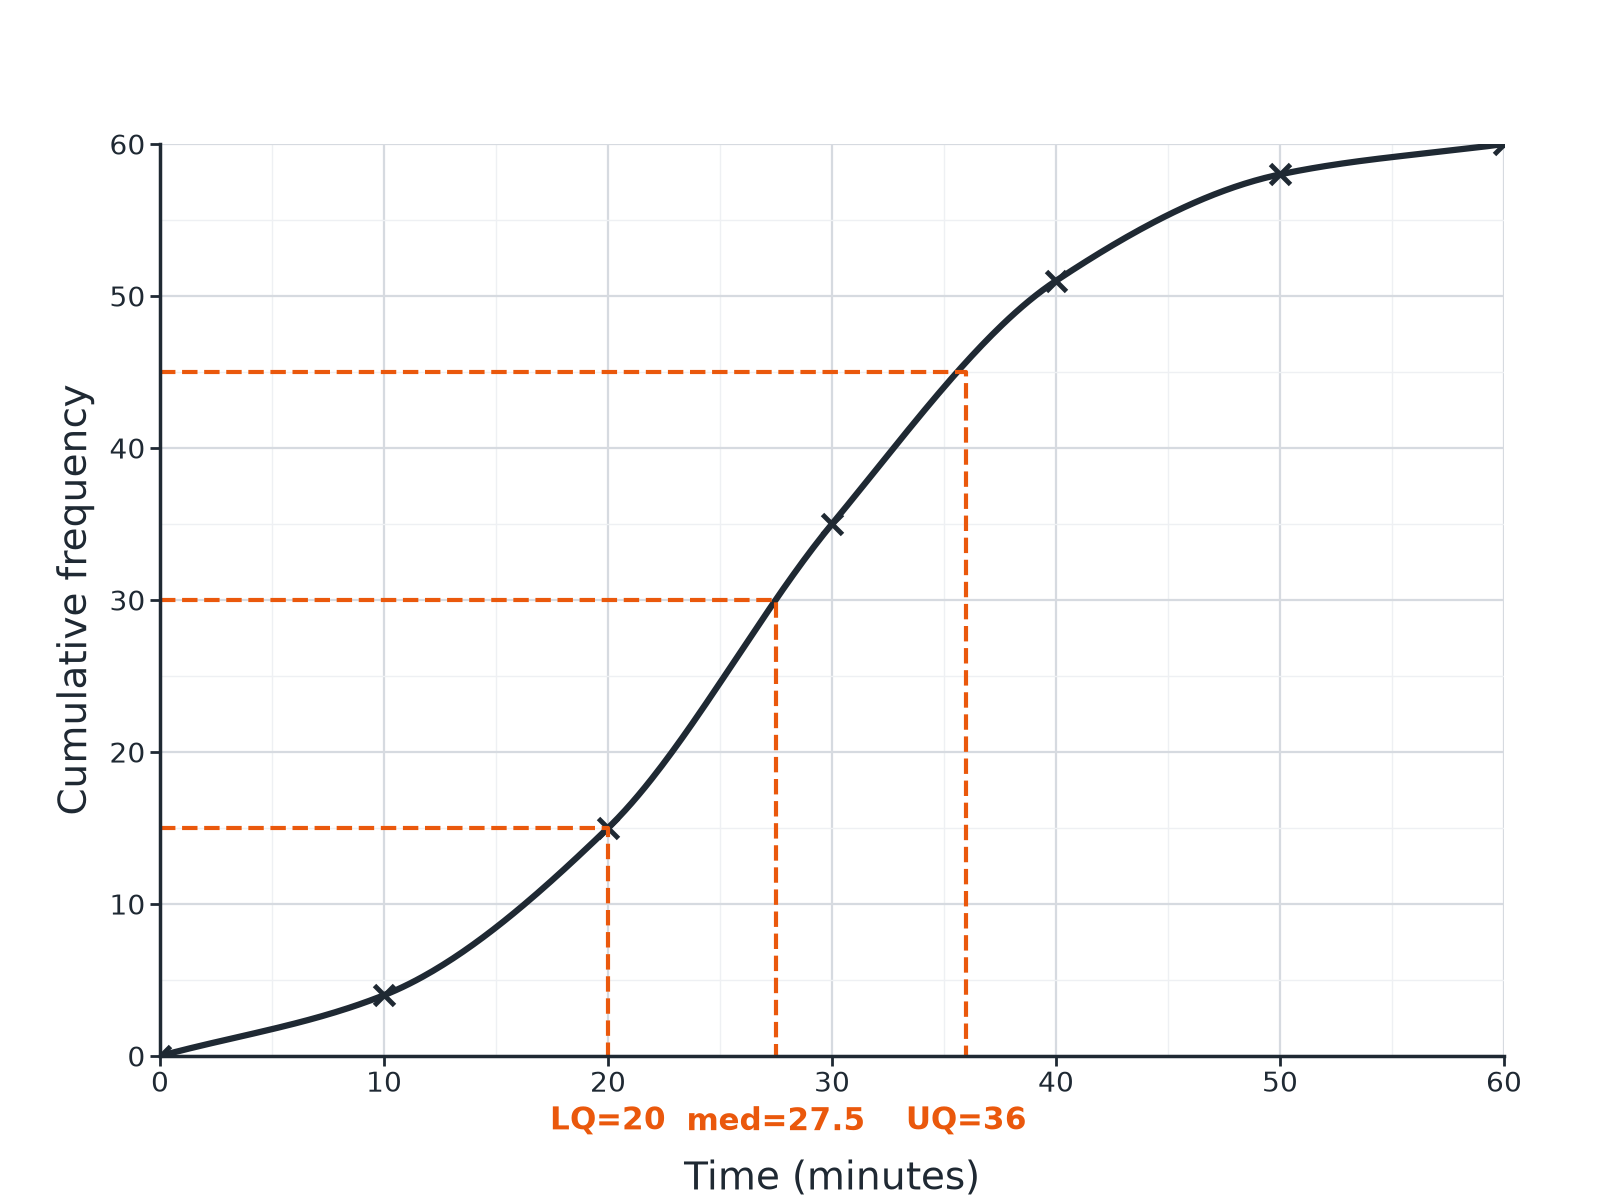
Read the quartiles at one quarter, one half and three quarters of the total.
openrevise.com
EDEXCEL GCSE MATHS · FOUNDATION & HIGHER
Reading Quartiles
Further statistics
Lesson 2 of 6
Use the total frequency n.
1
Median
Go across at n/2, then down to the x-axis
2
Lower quartile
Go across at n/4, then down
3
Upper quartile
Go across at 3n/4, then down
4
Interquartile range
IQR = UQ − LQ
openrevise.com
EDEXCEL GCSE MATHS · FOUNDATION & HIGHER
Median and Quartiles
Further statistics
Lesson 2 of 6
For the 60 students, estimate the median, the quartiles and the interquartile range.
1
Total
n = 60
2
Median
At 30: about 27.5 minutes
3
Lower quartile
At 15: 20 minutes
4
Upper quartile
At 45: about 36 minutes
5
Interquartile range
36 − 20 = 16 minutes
ANSWER
Median ≈ 27.5 minutes, IQR ≈ 16 minutes.
openrevise.com
EDEXCEL GCSE MATHS · FOUNDATION & HIGHER
How Many More Than...?
Further statistics
Lesson 2 of 6
Use the graph to estimate how many of the 60 students took more than 40 minutes.
1
Cumulative frequency at 40
51 students took 40 minutes or less
2
Subtract from the total
60 − 51 = 9
ANSWER
About 9 students took more than 40 minutes.
openrevise.com
EDEXCEL GCSE MATHS · FOUNDATION & HIGHER
Common Mistakes
Further statistics
Lesson 2 of 6
Watch for these.
Wrong boundary
Plot at the upper class boundary, not the middle of the class.
Straight lines
The graph is a smooth curve, not a polygon (unless the question says so).
Reading frequency, not value
Go across from the cumulative frequency, then down to the data value.
Forgetting the start
The curve starts at the lowest boundary with a cumulative frequency of 0.
openrevise.com
EDEXCEL GCSE MATHS · FOUNDATION & HIGHER
Key Terms
Further statistics
Lesson 2 of 6
Cumulative frequency
A running total of frequencies.
Upper class boundary
The largest value in a class.
Median
The middle value; the value at n/2.
Lower quartile
The value one quarter of the way through the data.
Upper quartile
The value three quarters of the way through the data.
Interquartile range
Upper quartile minus lower quartile.
openrevise.com
EDEXCEL GCSE MATHS · FOUNDATION & HIGHER
Further statistics
Lesson 2 of 6
YOUR TASK
Build a Cumulative Frequency Table
12 minutes
Heights (h cm) of 40 plants: 0 < h ≤ 10: 3, 10 < h ≤ 20: 9, 20 < h ≤ 30: 16, 30 < h ≤ 40: 8, 40 < h ≤ 50: 4. (a) Complete the cumulative frequency column. (b) At what value of n do you read the median?
1
Add each frequency to the running total.
2
The last total equals the total frequency.
WHAT A GOOD ANSWER SHOWS
(a) 3, 12, 28, 36, 40. (b) 40/2 = 20, which lies in the class 20 < h ≤ 30.
openrevise.com
EDEXCEL GCSE MATHS · FOUNDATION & HIGHER
Can I...?
Further statistics
Lesson 2 of 6
Find cumulative frequencies.
Plot at upper class boundaries.
Draw a smooth curve.
Read the median.
Read the quartiles.
Find the IQR.
Find how many are above or below a value.
Avoid common mistakes.
openrevise.com
EDEXCEL GCSE MATHS · FOUNDATION & HIGHER
Summary & Exam Focus
Plot cumulative frequency against upper class boundaries.
Median at n/2, LQ at n/4, UQ at 3n/4.
IQR = UQ − LQ.
Values read from a graph are estimates.
EXAM FOCUS
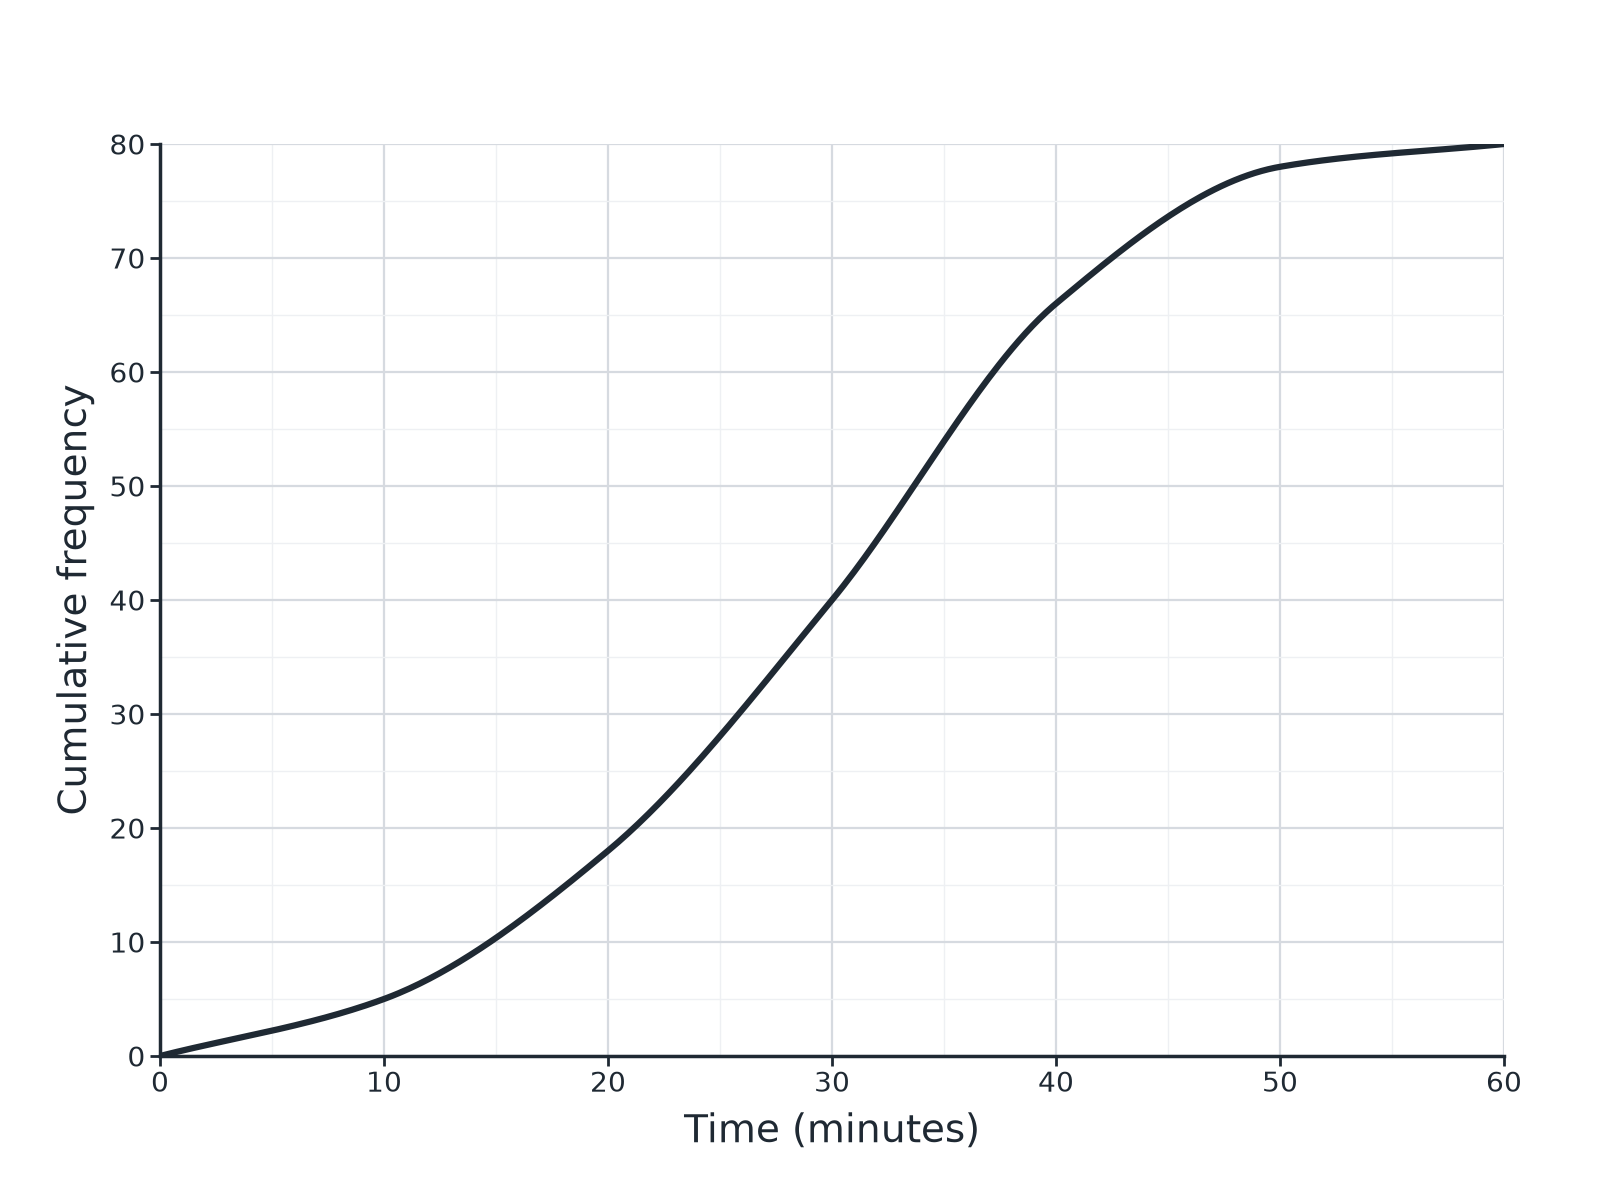
The cumulative frequency graph shows the times taken by 80 students. Use it to estimate the median and the interquartile range. (4 marks)
Show your dashed lines on the graph and write the values down.
openrevise.com
EDEXCEL GCSE MATHS · FOUNDATION & HIGHER
Exam Practice: Cumulative frequency
Further statistics
Lesson 2 of 6
Answer all questions. Show your working. · 30 minutes
Question 1 · 4 marks · Use the graph
The cumulative frequency graph shows the times, in minutes, taken by 80 students to complete a puzzle. Use the graph to find an estimate…
Question 2 · 2 marks · Use the graph
Use the same graph of the times taken by 80 students to estimate how many students took more than 45 minutes.
Question 3 · 2 marks · Complete
The table shows the times taken by 60 students. Frequencies: 0 < t ≤ 10: 4, 10 < t ≤ 20: 11, 20 < t ≤ 30: 20, 30 < t ≤ 40: 16, 40 < t ≤ 50…
openrevise.com
EDEXCEL GCSE MATHS · FOUNDATION & HIGHER
Exam Practice: Cumulative frequency (cont.)
Further statistics
Lesson 2 of 6
Question 4 · 2 marks · Explain
Explain why the points on a cumulative frequency graph are plotted at the upper class boundaries.
Question 5 · 3 marks · Draw
Describe how to draw a cumulative frequency graph from a table of grouped data.
Question 6 · 2 marks · Work out
A cumulative frequency graph shows the lower quartile is 20 and the upper quartile is 36. Work out the interquartile range and explain what…
openrevise.com
EDEXCEL GCSE MATHS · FOUNDATION & HIGHER
Question 1 · 4 marks · Use the graph
Further statistics
Lesson 2 of 6

The cumulative frequency graph shows the times, in minutes, taken by 80 students to complete a puzzle. Use the graph to find an estimate for (a) the median (b) the interquartile range. (4 marks)
openrevise.com
EDEXCEL GCSE MATHS · FOUNDATION & HIGHER
Question 1 · mark scheme
Further statistics
Lesson 2 of 6
4 marks available. Award a mark for each point made.
Median: reads across at 40
M1
30 (accept 29 to 31)
A1
LQ and UQ read at 20 and 60
M1
IQR about 17
A1
openrevise.com
EDEXCEL GCSE MATHS · FOUNDATION & HIGHER
Question 2 · 2 marks · Use the graph
Further statistics
Lesson 2 of 6
“
Use the same graph of the times taken by 80 students to estimate how many students took more than 45 minutes.
HOW TO ANSWER IT
Command word: Use the graph. Worth 2 marks, so plan before writing.
openrevise.com
EDEXCEL GCSE MATHS · FOUNDATION & HIGHER
Question 2 · mark scheme
Further statistics
Lesson 2 of 6
2 marks available. Award a mark for each point made.
Reads about 72 at 45
M1
80 − 72 = 8
A1
openrevise.com
EDEXCEL GCSE MATHS · FOUNDATION & HIGHER
Question 3 · 2 marks · Complete
Further statistics
Lesson 2 of 6
“
The table shows the times taken by 60 students. Frequencies: 0 < t ≤ 10: 4, 10 < t ≤ 20: 11, 20 < t ≤ 30: 20, 30 < t ≤ 40: 16, 40 < t ≤ 50: 7, 50 < t ≤ 60: 2. Work out the cumulative frequencies.
HOW TO ANSWER IT
Command word: Complete. Worth 2 marks, so plan before writing.
openrevise.com
EDEXCEL GCSE MATHS · FOUNDATION & HIGHER
Question 3 · mark scheme
Further statistics
Lesson 2 of 6
2 marks available. Award a mark for each point made.
At least 3 correct
M1
All correct
A1
openrevise.com
EDEXCEL GCSE MATHS · FOUNDATION & HIGHER
Question 4 · 2 marks · Explain
Further statistics
Lesson 2 of 6
“
Explain why the points on a cumulative frequency graph are plotted at the upper class boundaries.
HOW TO ANSWER IT
Command word: Explain. Worth 2 marks, so plan before writing.
openrevise.com
EDEXCEL GCSE MATHS · FOUNDATION & HIGHER
Question 4 · mark scheme
Further statistics
Lesson 2 of 6
2 marks available. Award a mark for each point made.
Cumulative frequency includes the whole class
M1
Only true at the upper boundary
C1
openrevise.com
EDEXCEL GCSE MATHS · FOUNDATION & HIGHER
Question 5 · 3 marks · Draw
Further statistics
Lesson 2 of 6
“
Describe how to draw a cumulative frequency graph from a table of grouped data.
HOW TO ANSWER IT
Command word: Draw. Worth 3 marks, so plan before writing.
openrevise.com
EDEXCEL GCSE MATHS · FOUNDATION & HIGHER
Question 5 · mark scheme
Further statistics
Lesson 2 of 6
3 marks available. Award a mark for each point made.
Running totals
B1
Plot at upper boundaries
B1
Smooth curve
B1
openrevise.com
EDEXCEL GCSE MATHS · FOUNDATION & HIGHER
Question 6 · 2 marks · Work out
Further statistics
Lesson 2 of 6
“
A cumulative frequency graph shows the lower quartile is 20 and the upper quartile is 36. Work out the interquartile range and explain what it tells you.
HOW TO ANSWER IT
Command word: Work out. Worth 2 marks, so plan before writing.
openrevise.com
EDEXCEL GCSE MATHS · FOUNDATION & HIGHER
Question 6 · mark scheme
Further statistics
Lesson 2 of 6
2 marks available. Award a mark for each point made.
16
B1
The spread of the middle 50%
C1
openrevise.com
← → to move, F to present full screen, G for every slide at once.