Maths · Probability
Viewing as
Teaching this? The teacher view opens every answer and mark scheme.
Frequency Trees and Two-Way Tables
Completing frequency trees and two-way tables and using them to find probabilities.
Learning Objectives
- 1Complete a two-way table from given totals.
- 2Draw and complete a frequency tree.
- 3Use a two-way table or frequency tree to work out probabilities.
- 4Use probabilities and frequencies together to estimate numbers (expected frequencies).
Organising counts
A two-way table sorts people or objects by two features at once, such as year group and how they travel to school. A frequency tree does the same job with branches, using numbers of people rather than probabilities. Both turn a wordy problem into a picture where missing numbers can be found by simple addition and subtraction. The golden rule is that rows add up to their totals and columns add up to theirs, so every blank can be found from the ones around it.
Two-way tables
Each cell is the number of items that have both features, and the totals are on the right and at the bottom.
-
Rows and columns
Each row adds up to its total on the right, and each column adds up to its total at the bottom.
-
The grand total
The total of the totals, in the bottom right corner, is how many there are altogether, and it is the same whichever way you add.
-
Find a blank
Look for a row or a column with only one blank. Subtract the known numbers from the total.
-
Check
Add the row totals and the column totals, and both should give the grand total.
Completing a two-way table
In a survey of 100 students, 50 are in Year 10 and 50 are in Year 11. 44 travel by bus, and 13 cycle. Of the Year 10 students, 24 go by bus and 18 walk. Of the Year 11 students, 25 walk. Work out how many Year 11 students cycle.
Show the solutionHide the solution
- 1 Year 10 cycling \(50 - 24 - 18 = 8\).
- 2 Total cycling The cycling column totals 13, so Year 11 cycling \(= 13 - 8 = 5\).
- 3 Check with the Year 11 row Year 11 bus is \(44 - 24 = 20\), and \(20 + 25 + 5 = 50\). Correct.
- 4 Check the grand total \(50 + 50 = 100\).
Answer5
A frequency tree
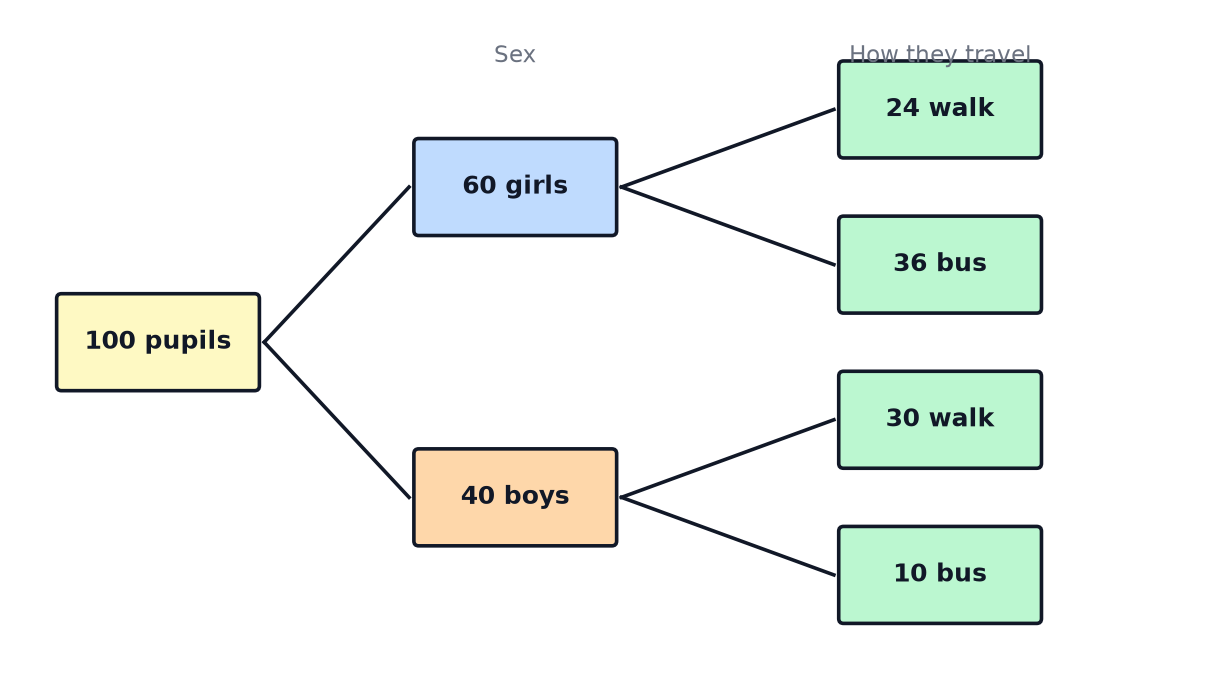
In a frequency tree the numbers on each pair of branches add up to the number they came from: \(60 + 40 = 100\), \(24 + 36 = 60\) and \(30 + 10 = 40\).
Using the frequency tree
- Total who walk \(24 + 30 = 54\).
- Total who take the bus \(36 + 10 = 46\).
- Girls who walk 24 out of 100, so the probability is \(\dfrac{24}{100} = \dfrac{6}{25}\).
- Boys as a fraction of pupils \(\dfrac{40}{100} = \dfrac{2}{5}\).
Building a frequency tree
Start at the left with the total and split it in stages.
-
Use the information in order
The first split is by the first feature, such as girls and boys.
-
Subtract for the other branch
If 60 of 100 are girls, then \(100 - 60 = 40\) are boys.
-
Use percentages or fractions
"40% of the girls walk" means \(0.4 \times 60 = 24\) walk and \(60 - 24 = 36\) take the bus.
-
Check each pair
Each pair of branches must add to the number on the left.
A frequency tree from percentages
200 people go to a gym. 60% are women. 25% of the women and 40% of the men go in the morning. Work out how many people go in the morning.
Show the solutionHide the solution
- 1 Women and men \(60\% \text{ of } 200 = 120\) women, so \(200 - 120 = 80\) men.
- 2 Women in the morning \(25\% \text{ of } 120 = 30\).
- 3 Men in the morning \(40\% \text{ of } 80 = 32\).
- 4 Add \(30 + 32 = 62\), so 62 people go in the morning.
Answer62
Probability from tables and trees
The total is on the bottom, and the number in the cell, or the sum of cells, is on the top.
-
One cell
In the survey of 100 students, \(P(\text{Year 10 and bus}) = \dfrac{24}{100} = \dfrac{6}{25}\).
-
A row or a column
\(P(\text{cycles}) = \dfrac{13}{100}\), because the cycling column total is 13.
-
Combining cells
\(P(\text{Year 11 and walks or cycles}) = \dfrac{25 + 5}{100} = \dfrac{3}{10}\).
-
Estimating numbers
If the probability is \(\dfrac{13}{100}\), then out of 500 students you would expect \(\dfrac{13}{100} \times 500 = 65\) to cycle.
Test yourself
-
1
Where do the totals go in a two-way table?
Show answerHide answer
At the end of each row and the bottom of each column.
-
2
How do you find a missing value in a row?
Show answerHide answer
Subtract the known values from the row total.
-
3
What do the numbers on a pair of branches in a frequency tree add up to?
Show answerHide answer
The number they came from.
-
4
What is 40% of 80?
Show answerHide answer
32.
-
5
How do you find the probability from a two-way table?
Show answerHide answer
The number in the cell, divided by the grand total.
Exam technique: tables and trees
Fill in everything you can before you answer the question.
-
Complete the whole table
Fill every blank, and use the totals to check.
-
Read the row and column headings
Many errors come from taking a number from the wrong row.
-
Put the denominator right
The total on the bottom of a probability is the whole group, not a part of it.
-
Show subtractions
\(50 - 24 - 18 = 8\) is a method mark.
Summary and exam focus
- A two-way table sorts data by two features, with row and column totals.
- Find missing numbers by adding or subtracting from totals, and check the grand total.
- A frequency tree splits a total in stages, and each pair of branches adds to the number before it.
- Probabilities from a table are the cell or sum of cells divided by the grand total.
Exam focus
In a survey, 50 people were asked whether they have a cat or a dog. 28 have a cat, 20 have a dog, and 6 have both. Draw a two-way table to show this, and work out how many have neither. (4 marks) (4 marks)
With 6 owning both, 22 own a cat only and 14 own a dog only. That is \(22 + 14 + 6 = 42\) with at least one pet, so \(50 - 42 = 8\) have neither. Check by adding the table back up to 50.
Key terms
The words this lesson expects you to use. Each one is linked from the first place it appears above.
- Two-way table
- A table that shows how many items have each combination of two features.
- Frequency tree
- A tree diagram with the number of items on each branch.
- Frequency
- The number of times something happens or the number of items in a group.
- Row
- A horizontal line of cells in a table.
- Column
- A vertical line of cells in a table.
- Total
- The sum of a row, a column or the whole table.
- Grand total
- The total of everything in the table.
- Survey
- A set of questions asked to a group of people to collect data.
- Expected frequency
- The number of times you expect something to happen, found as probability times the number of trials.
You've finished the notes
Check your understanding
Test yourself while it is fresh. Start with the flashcards, then try the exam questions.
Something here looks wrong?
Tell us what and we will go and look. It goes to whoever writes these pages, nobody else, and we do not ask who you are — so there is nothing to sign and nothing comes back to you.