Viewing as
Teacher view: planning notes, the answers to every question, and the teacher copies of the files.
Maths · Graphs
Real-life graphs
Conversion graphs, cost graphs with a fixed charge, comparing two deals, and matching the shape of a container to the graph of its depth as it fills - reading what the gradient and intercept mean in context.
Teacher resources
The teacher copies: slides with the questions built in, the answers, and anything else attached to this lesson for whoever is teaching it.
- Real-life graphs - Teacher Slides.pptx Teacher The lesson slides with the teacher's notes on each slide, and every question and mark scheme built in. Built from the lesson script on 29 September 2026. View
- Real-life graphs - Teacher Notes.docx Teacher The complete notes with the teacher's notes and every model answer in full. Built from the lesson script on 29 September 2026. View
Student handouts
The same files the students see, to print or hand out.
- Real-life graphs.pptx Built from the lesson script on 29 September 2026. View
- Real-life graphs - Completed Notes.docx The full notes for the lesson, to revise from. Built from the lesson script on 29 September 2026. View
- Real-life graphs - Exam Questions.docx Built from the lesson script on 29 September 2026. View
Last Lesson and Before
Answer each one, then check.
-
1
Last lesson: what does the gradient of a distance-time graph show?
Show answerHide answer
Speed
-
2
What is the \(y\)-intercept of \(y = 1.5x + 3\)?
Show answerHide answer
3
-
3
5 miles is about 8 km. About how many km is 20 miles?
Show answerHide answer
32 km
-
4
Work out \(20 + 0.05 \times 300\).
Show answerHide answer
35
Learning Objectives
- 1Use conversion graphs.
- 2Draw and read cost graphs, and explain the gradient and intercept.
- 3Use graphs to compare two options.
- 4Match container shapes to graphs of depth against time.
A Conversion Graph
A conversion graph is a straight line through the origin, because the two units are in direct proportion. Read up from one axis to the line, then across to the other. For values off the graph, scale up: 125 miles is \(5 \times 25\) miles, so about \(5 \times 40 = 200\) km.
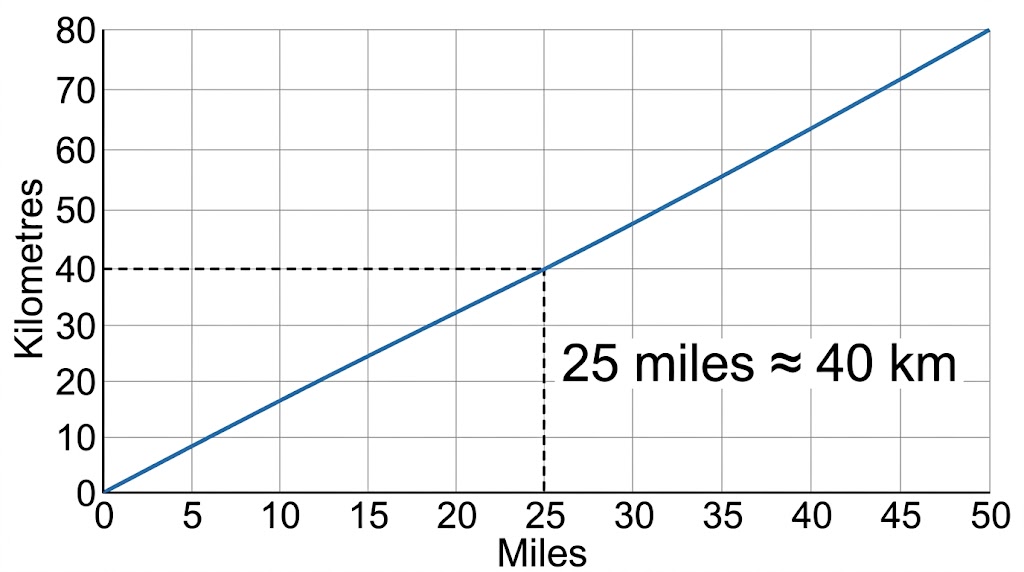
25 miles is about 40 km.
Cost Graphs
A taxi charges a fixed £3, plus £1.50 per mile: \(C = 1.5m + 3\).
-
The intercept
Where the line meets the cost axis: the fixed charge, paid even for 0 miles.
-
The gradient
The cost per mile: £1.50.
-
Not through the origin
A fixed charge means cost is NOT directly proportional to distance.
-
Reading off
8 miles: \(1.5 \times 8 + 3 = £15\).
Comparing Two Deals
Phone plan A costs £20 a month plus 5p per minute. Plan B costs 15p per minute, with no monthly charge. For how many minutes do they cost the same? Which is cheaper for 300 minutes?
Show the solutionHide the solution
- 1 Write a formula for each A: \(C = 20 + 0.05m\); B: \(C = 0.15m\)
- 2 They cost the same where the lines cross \(20 + 0.05m = 0.15m\)
- 3 Solve \(20 = 0.1m\), so \(m = 200\)
- 4 300 minutes A: \(20 + 15 = £35\); B: \(£45\)
AnswerThe same at 200 minutes; plan A is cheaper for 300 minutes.
Filling Containers
Water pours in at a steady rate. The graph of depth against time depends on the width of the container.
-
Straight sides
A cylinder or cuboid fills at a steady rate: a straight line.
-
Wider at the top
The depth rises quickly at first, then more slowly: a curve that gets less steep.
-
Narrower at the top
The depth rises slowly at first, then faster: a curve that gets steeper.
-
Wide then narrow parts
Each section of the container gives its own section of graph; a narrow section gives a steeper part.
Shape and Graph
-
Cylinder
How the width changes: Same width all the way up. Graph of depth: Straight line
-
Vase, wide at the top
How the width changes: Gets wider. Graph of depth: Curve, getting less steep
-
Cone, point up
How the width changes: Gets narrower. Graph of depth: Curve, getting steeper
-
Flask: wide base, narrow neck
How the width changes: Wide, then narrow. Graph of depth: Line, then a steeper line
Which Taxi?
Taxi X charges £2 plus £2 per mile. Taxi Y charges £6 plus £1.50 per mile. Draw both graphs for 0 to 12 miles on the same axes. For which journeys is each taxi cheaper?
1. Make a table of values for each taxi.
2. Plot both lines on the same axes.
3. Find where they cross.
A good answer shows: X: \(C = 2m + 2\); Y: \(C = 1.5m + 6\). They cross where \(2m + 2 = 1.5m + 6\), so \(m = 8\) miles (£18). X is cheaper under 8 miles; Y is cheaper over 8 miles.
Can I...?
- 1Read a conversion graph both ways.
- 2Use a conversion graph for values off the scale.
- 3Explain the gradient of a real-life graph.
- 4Explain the intercept of a real-life graph.
- 5Compare two options using graphs.
- 6Match a container to its depth-time graph.
Summary & Exam Focus
- Conversion graph: straight line through the origin.
- Cost graph: intercept = fixed charge; gradient = cost per unit.
- Two lines cross where the options cost the same.
- Narrow parts of a container fill faster: a steeper graph.
Exam focus
Plan A costs £20 a month plus 5p per minute. Plan B costs 15p per minute. Jo uses about 300 minutes a month. Which plan should she choose? (3 marks) (3 marks)
When asked what the gradient or intercept "represents", answer in context with units: "the cost per mile is £1.50", not just "the gradient is 1.5".
Key terms
The vocabulary this lesson expects you to use. Each one is linked from the first place it appears above.
- Conversion graph
- A graph for changing between two units.
- Fixed charge
- A cost that is paid whatever the amount used; the \(y\)-intercept.
- Direct proportion
- Two quantities whose graph is a straight line through the origin.
- Break-even point
- Where two cost lines cross, so both options cost the same.
Questions and answers
7 questions set on this lesson, with the mark schemes and model answers open.
50 miles is 80 km. (a) Convert 125 miles to kilometres. (b) Convert 360 km to miles.
Mark scheme — 3 marks available
- (a) 200 km — B1
- (b) \(360 \times \frac{50}{80}\), or \(360 \div 1.6\) — M1
- (b) 225 miles — A1
Model answer
(a) \(125 = 2.5 \times 50\), so \(2.5 \times 80 = 200\) km. (b) 1 km = \(\frac{50}{80}\) mile, so \(360 \times \frac{50}{80} = 225\) miles.
A taxi charges a fixed amount plus a cost for each mile. The cost of a journey of \(m\) miles is \(C = 1.5m + 3\) pounds. (a) Work out the cost of an 8-mile journey. (b) What does the 3 represent? (c) What does the 1.5 represent?
Mark scheme — 3 marks available
- (a) £15 — B1
- (b) Fixed charge, or the cost before any miles — C1
- (c) Cost per mile — C1
Model answer
(a) \(1.5 \times 8 + 3 = £15\) (b) A fixed charge of £3 (c) The cost per mile, £1.50
Plan A costs £20 a month plus 5p per minute of calls. Plan B costs 15p per minute, with no monthly charge. Jo uses 300 minutes of calls a month. Which plan is cheaper for Jo? Show your working.
Mark scheme — 3 marks available
- \(20 + 0.05 \times 300\) — M1
- \(0.15 \times 300\) — M1
- £35 and £45, and plan A — A1
Model answer
A: \(20 + 0.05 \times 300 = £35\). B: \(0.15 \times 300 = £45\). Plan A is cheaper.
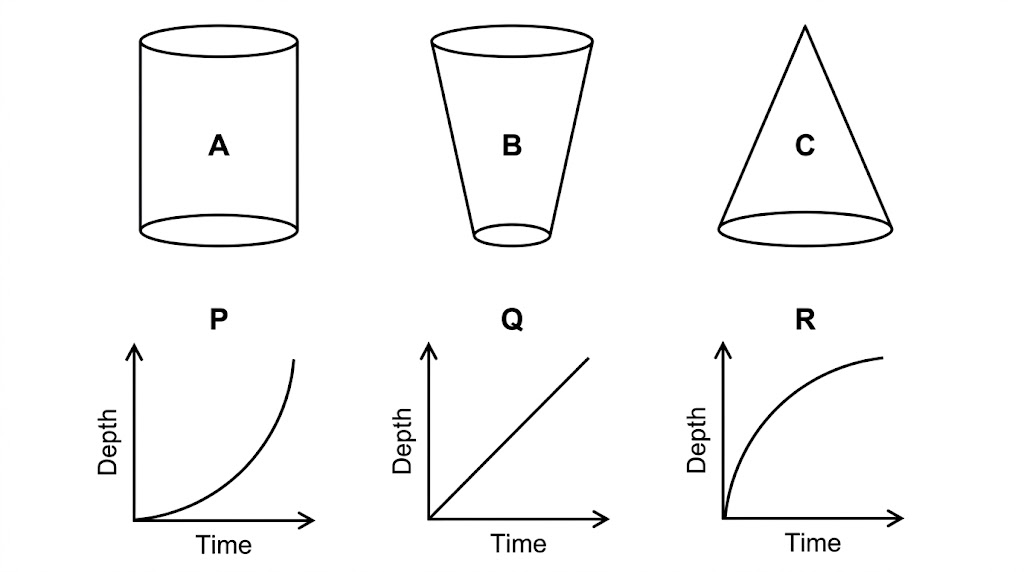
Water is poured at a constant rate into each of the containers A, B and C. The graphs P, Q and R show the depth of water against time. Match each container to its graph.
Mark scheme — 2 marks available
- At least one correct match — B1
- All three correct: A-Q, B-R, C-P — B1
Model answer
A (cylinder) - Q (straight line). B (wider at the top) - R (curve getting less steep). C (narrower at the top) - P (curve getting steeper).
A graph of cost against units used crosses the cost axis at £12. What does the £12 represent?
Why: The cost when 0 units are used is a fixed charge.
Which container fills with a straight-line graph of depth against time?
Why: A cylinder has the same width all the way up, so the depth rises at a constant rate.
£1 = $1.25. What is the gradient of the graph of dollars (up) against pounds (across)?
Why: Every £1 across gives $1.25 up.