Viewing as
Teacher view: planning notes, the answers to every question, and the teacher copies of the files.
Maths · Further statistics
Comparing and describing distributions
Compare data sets using averages and spread, use cumulative frequency curves and box plots to compare, and describe the shape (skew) of a distribution.
Teacher resources
The teacher copies: slides with the questions built in, the answers, and anything else attached to this lesson for whoever is teaching it.
- Comparing and describing distributions - Teacher Slides.pptx Teacher The lesson slides with the teacher's notes on each slide, and every question and mark scheme built in. Built from the lesson script on 30 September 2026. View
- Comparing and describing distributions - Teacher Notes.docx Teacher The complete notes with the teacher's notes and every model answer in full. Built from the lesson script on 30 September 2026. View
Student handouts
The same files the students see, to print or hand out.
- Comparing and describing distributions.pptx Built from the lesson script on 30 September 2026. View
- Comparing and describing distributions - Completed Notes.docx The full notes for the lesson, to revise from. Built from the lesson script on 30 September 2026. View
- Comparing and describing distributions - Exam Questions.docx Built from the lesson script on 30 September 2026. View
Warm-up
Answer each one, then check.
-
1
Name a measure of average.
Show answerHide answer
Mean, median or mode
-
2
Name a measure of spread.
Show answerHide answer
Range or interquartile range
-
3
What is an outlier?
Show answerHide answer
A value far from the others
-
4
Does an outlier affect the median much?
Show answerHide answer
No
-
5
Does an outlier affect the mean much?
Show answerHide answer
Yes
Learning Objectives
- 1Compare two distributions using an average and a measure of spread.
- 2Choose the best average and spread.
- 3Describe skew.
- 4Write comparisons in context.
COMPARING
To compare distributions, compare one average and one measure of spread, using numbers and context.
A higher average means the values are generally bigger. A larger spread means the values are less consistent.
The Shape of a Distribution
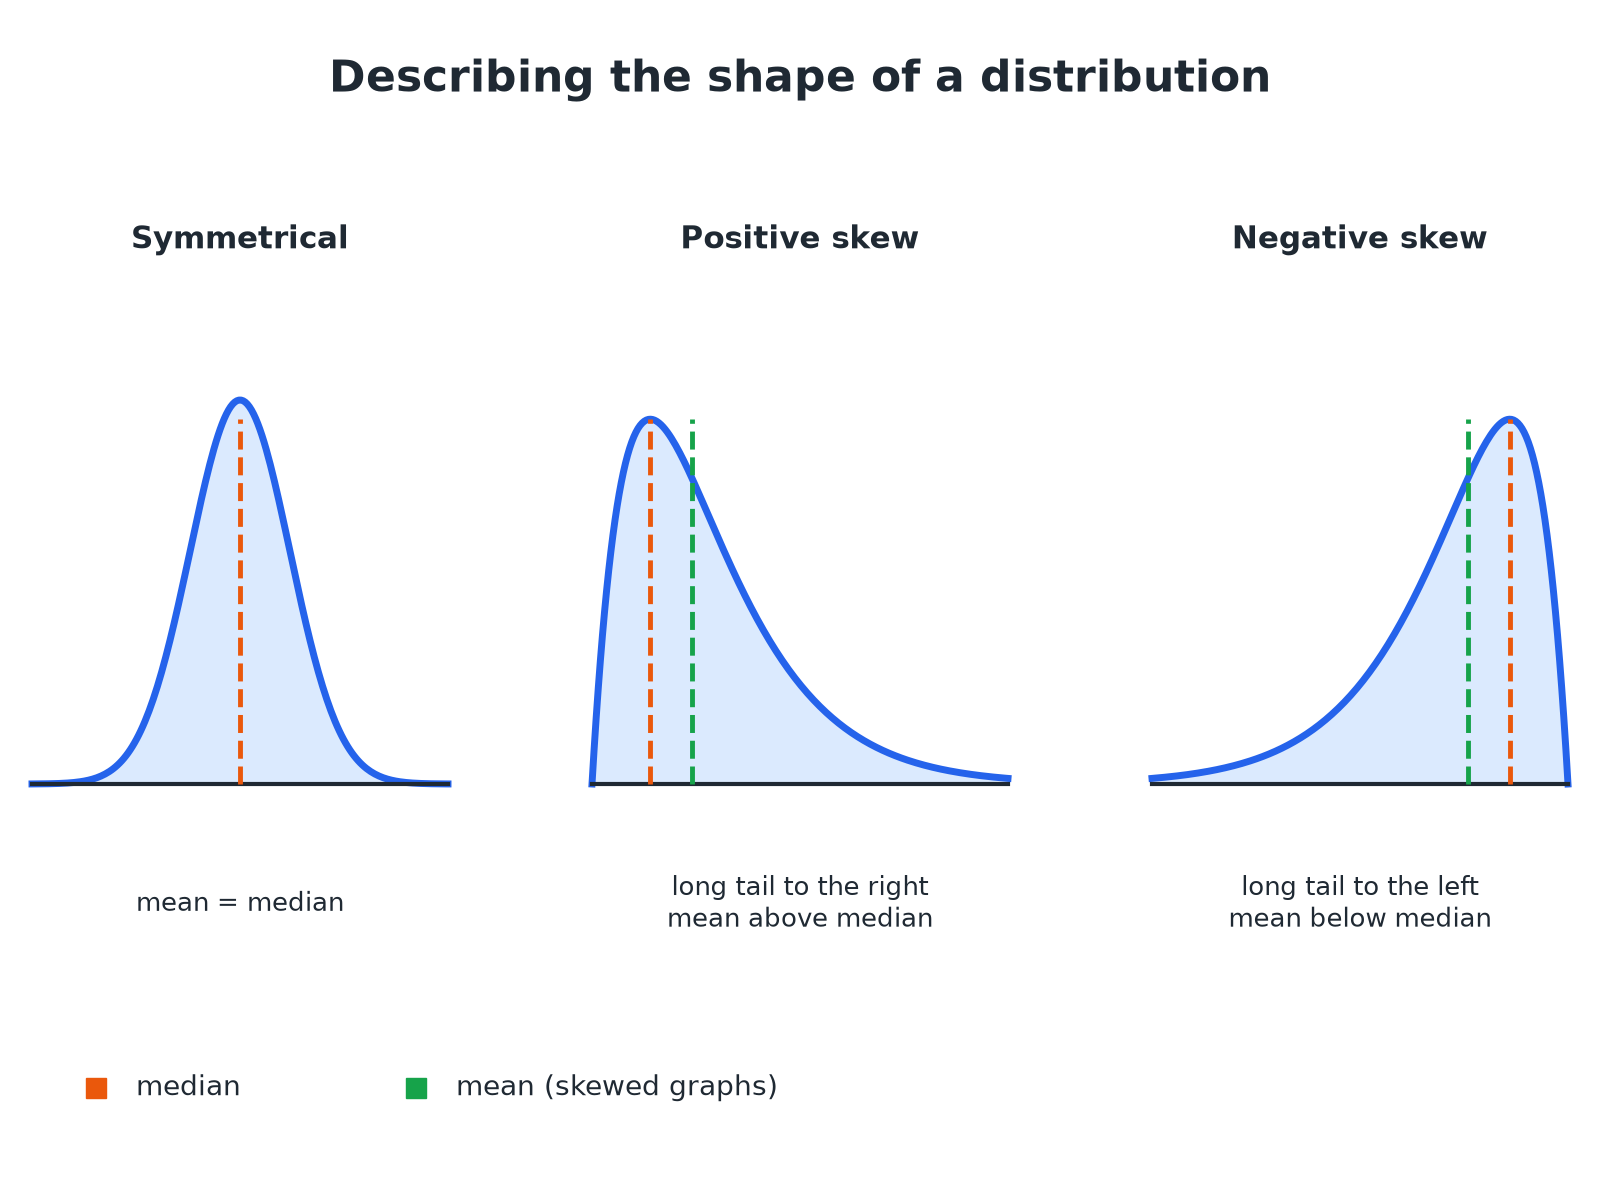
The tail shows the direction of the skew.
Choosing Averages and Spreads
Averages
- Mean uses every value, but is affected by outliers.
- Median is not affected by outliers.
- Mode is the most common value.
Spreads
- Range uses the largest and smallest values only.
- IQR is the spread of the middle 50%.
- IQR is not affected by outliers.
Comparing Two Data Sets
Boys: median 12.4 s, IQR 1.2 s. Girls: median 13.1 s, IQR 2.0 s. Compare the times for the 100 m sprint.
Show the solutionHide the solution
- 1 Average Boys' median 12.4 is lower than girls' 13.1
- 2 Meaning On average the boys were faster
- 3 Spread Boys' IQR 1.2 is smaller than girls' 2.0
- 4 Meaning The boys' times were more consistent
AnswerOn average the boys were faster (median 12.4 s against 13.1 s) and their times were more consistent (IQR 1.2 s against 2.0 s).
Comparing Cumulative Frequency Curves
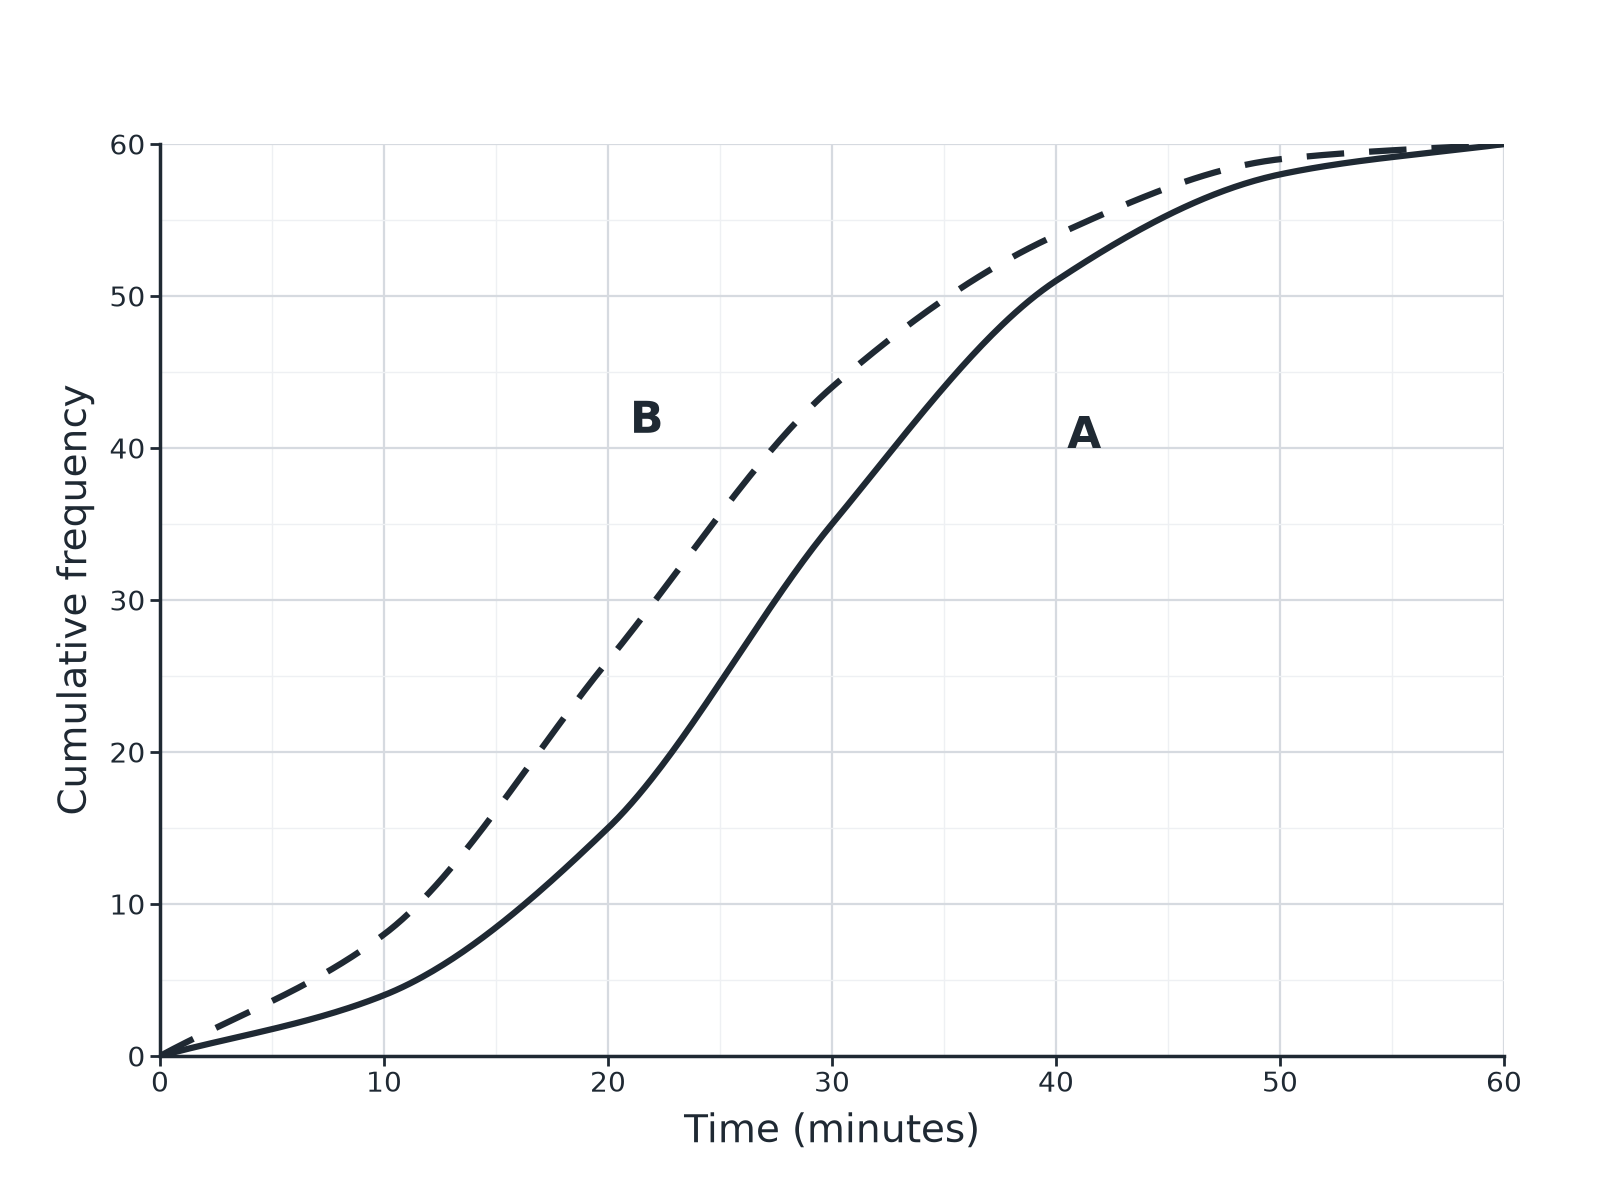
Two cumulative frequency curves show the times of Group A and Group B (60 people each). Group A: median 28, IQR 16. Group B: median 22, IQR 17. Compare the groups.
Show the solutionHide the solution
- 1 Median B's median is lower
- 2 Spread The IQRs are very close
- 3 Conclusion Group B were quicker on average, with a similar spread
AnswerGroup B were quicker on average (median 22 against 28) and both groups had a similar spread (IQR 17 against 16).
Describing Skew
The mean is 30 and the median is 25. Describe the skew.
Show the solutionHide the solution
- 1 Compare The mean is greater than the median
- 2 Shape The tail is to the right
AnswerThe distribution has positive skew.
Writing Good Comparisons
A full-mark answer has four parts.
-
An average
Compare medians or means, quoting numbers.
-
A spread
Compare IQRs or ranges, quoting numbers.
-
Context
Write in terms of the situation.
-
A conclusion
For example "so Group B were faster and more consistent".
Write the Comparison
Set A: mean 24, range 10. Set B: mean 21, range 25. Write a comparison of the two sets.
1. Compare averages.
2. Compare spreads.
A good answer shows: On average Set A has higher values (mean 24 against 21) and Set A is more consistent (range 10 against 25).
Can I...?
- 1Compare two medians.
- 2Compare two IQRs.
- 3Compare means and ranges.
- 4Read a cumulative frequency graph.
- 5Describe skew.
- 6Write in context.
- 7Use numbers.
- 8Explain the choice of average.
Summary & Exam Focus
- Compare one average and one spread.
- Median and IQR are best if there are outliers.
- Positive skew: long tail to the right, mean above median.
- Give numbers and a conclusion.
Exam focus
The cumulative frequency graph shows the times taken by two groups. Compare the times. (4 marks) (4 marks)
Compare an average and a spread, and use the words of the question.
Key terms
The vocabulary this lesson expects you to use. Each one is linked from the first place it appears above.
- Distribution
- How values are spread across a data set.
- Skew
- A lack of symmetry; the tail shows the direction.
- Symmetrical
- The same on both sides of the middle.
- Outlier
- A value much larger or smaller than the rest.
- Consistent
- Little variation.
- In context
- Written using the real situation.
Questions and answers
12 questions set on this lesson, with the mark schemes and model answers open.
The cumulative frequency graphs show the times taken by 60 people in Group A and 60 people in Group B to complete a puzzle. Compare the times taken by the two groups.
Mark scheme — 4 marks available
- Median for each read from the graph — M1
- Comment on average in context — A1
- IQR for each read from the graph — M1
- Comment on spread in context — A1
Model answer
The median for B (about 22) is lower than for A (about 28), so B were quicker on average. The IQRs are similar (B about 17, A about 16), so the spread is similar.
Boys: median 12.4 s, interquartile range 1.2 s. Girls: median 13.1 s, interquartile range 2.0 s. Write down two comparisons.
Mark scheme — 2 marks available
- Average compared in context — B1
- Spread compared in context — B1
Model answer
On average the boys were faster (12.4 s against 13.1 s). The boys' times were more consistent (IQR 1.2 s against 2.0 s).
Set A has mean 24 and range 10. Set B has mean 21 and range 25. Compare the two sets.
Mark scheme — 2 marks available
- Compares means — B1
- Compares ranges — B1
Model answer
Set A has a higher mean (24 against 21). Set A has a smaller range (10 against 25), so it is more consistent.
A distribution has a mean of 30 and a median of 25. Describe the skew of the distribution.
Mark scheme — 2 marks available
- Mean above median — M1
- Positive skew — A1
Model answer
The mean is greater than the median, so the distribution has positive skew (a long tail to the right).
A data set has one very large outlier. Explain why the median is a better average than the mean.
Mark scheme — 2 marks available
- Mean affected by outlier — M1
- Median not affected — C1
Model answer
The outlier pulls the mean up but has almost no effect on the median, so the median better represents the typical value.
The mean time for pupils in a London school is lower than in a school in Leeds. Ben says every pupil in the London school must be faster than every pupil in Leeds. Explain why Ben is wrong.
Mark scheme — 2 marks available
- Mean is an average only — M1
- Individual values may overlap — C1
Model answer
The mean is only an average. Some pupils in the London school could be slower than some in Leeds; the data may be spread widely.
To compare two data sets you should compare...
Why: An average and a measure of spread.
Which measure of spread is not affected by outliers?
Why: The interquartile range uses only the middle half.
A smaller IQR means the data are...
Why: More consistent.
Mean 30 and median 25 suggests...
Why: Positive skew.
A symmetrical distribution has...
Why: The mean equal to the median.
In a comparison, "in context" means...
Why: Using the real situation in your wording, such as "the boys were faster".