Viewing as
Teaching this? The teacher view adds 2 files, the mark schemes and the model answers.
Maths · Further statistics
Sampling
Understand populations and samples, spot bias, take random, stratified and systematic samples, and estimate a population using capture-recapture.
Warm-up
Answer each one, then check.
-
1
What is a percentage of an amount, e.g. 10% of 300?
Show answerHide answer
\(30\)
-
2
What is the mean of 4, 6 and 8?
Show answerHide answer
\(6\)
-
3
Simplify the ratio \(20 : 30\).
Show answerHide answer
\(2 : 3\)
-
4
What does "random" mean?
Show answerHide answer
Every item has an equal chance of being chosen
-
5
What is a fraction of a total, e.g. \(\tfrac{1}{4}\) of 80?
Show answerHide answer
\(20\)
Learning Objectives
- 1Explain the difference between a population and a sample.
- 2Recognise and describe bias in a sample.
- 3Take a random, a systematic and a stratified sample.
- 4Estimate a population size using capture-recapture (Higher).
SAMPLING
A sample should be a small group that fairly represents the whole population.
A bigger, random sample is more likely to be representative and give reliable results.
Population and Stratified Sample
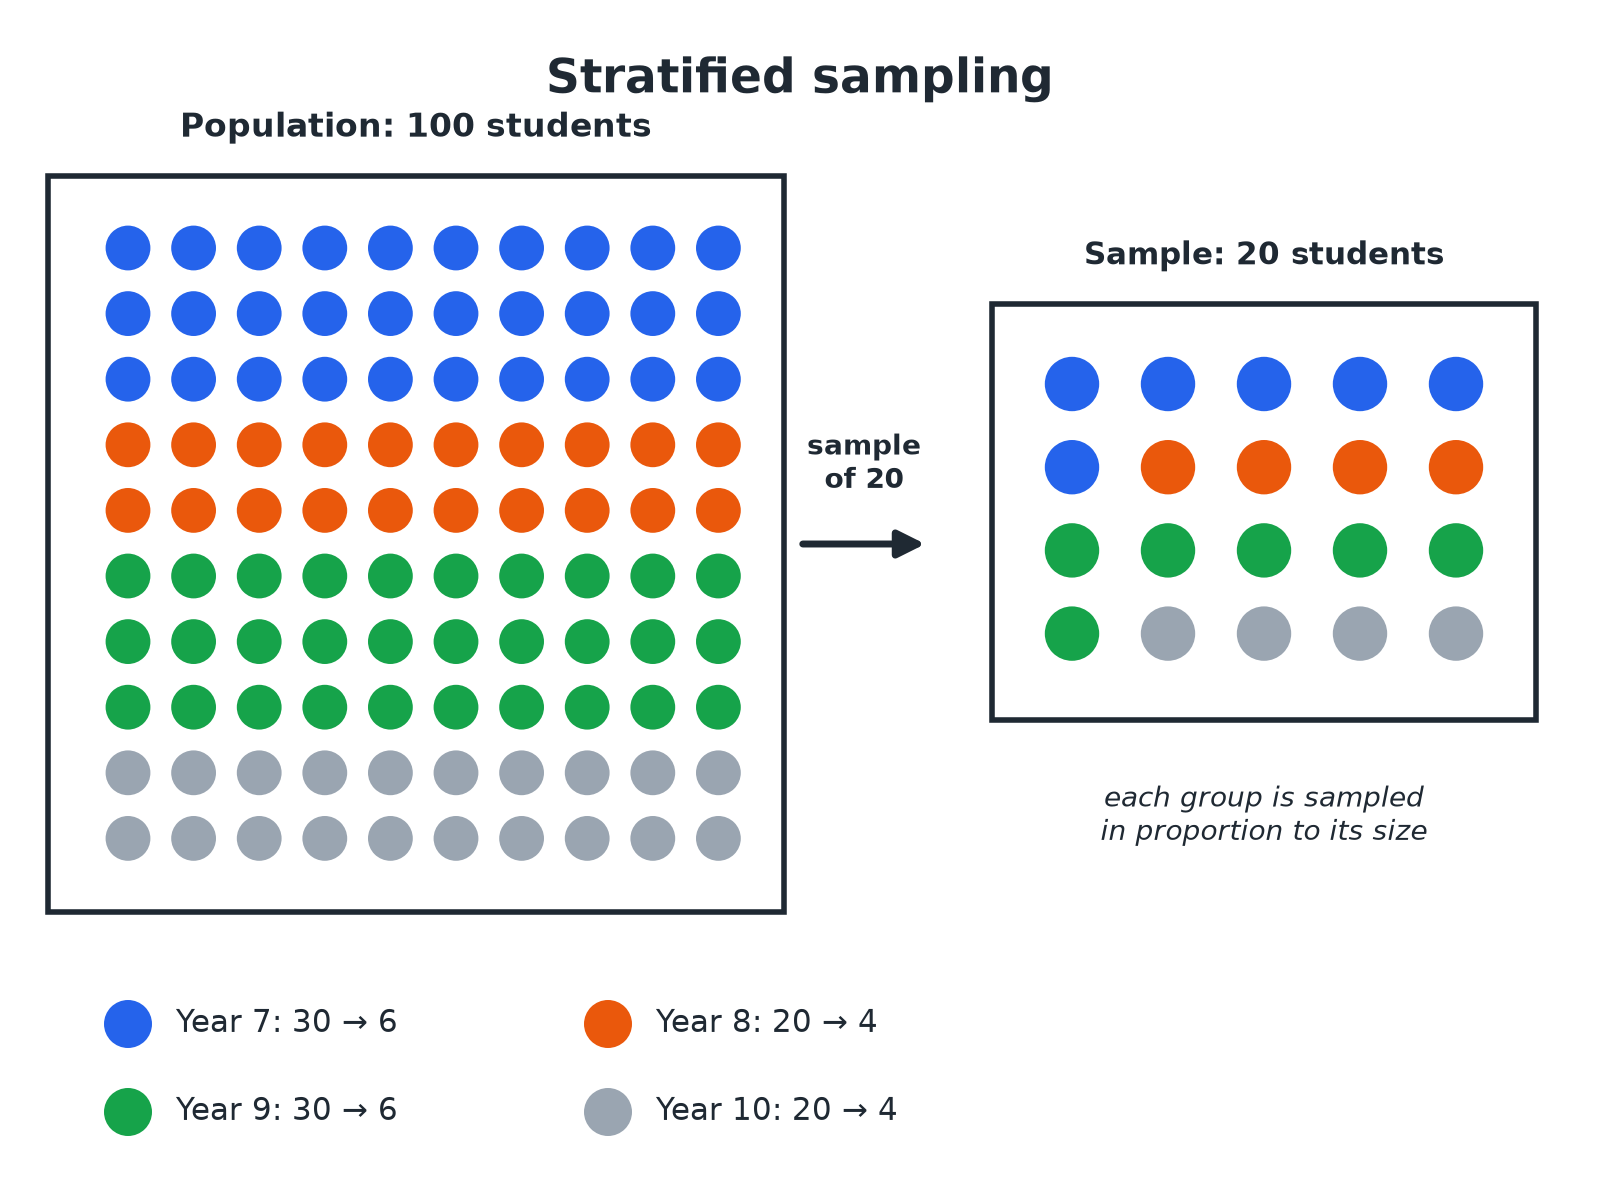
A stratified sample keeps the same proportions as the population.
Types of Sample
Know how each one is chosen.
-
Random
How it is chosen: Every member has an equal chance, e.g. numbers from a random number generator. Good point: Not biased
-
Systematic
How it is chosen: Every \(k\)th member from a list, after a random start. Good point: Easy and quick
-
Stratified
How it is chosen: Groups sampled in proportion to their size. Good point: Represents every group
-
Convenience
How it is chosen: The people who are easiest to reach. Good point: Cheap, but often biased
A Stratified Sample
A school has 200 pupils in Year 9, 160 in Year 10 and 240 in Year 11. A stratified sample of 60 pupils is taken. How many pupils come from each year?
Show the solutionHide the solution
- 1 Total pupils \(200 + 160 + 240 = 600\)
- 2 Fraction sampled \(\dfrac{60}{600} = \dfrac{1}{10}\)
- 3 Year 9 \(200 \div 10 = 20\)
- 4 Year 10 \(160 \div 10 = 16\)
- 5 Year 11 \(240 \div 10 = 24\)
Answer20 from Year 9, 16 from Year 10 and 24 from Year 11.
A Systematic Sample
A list has 800 names. A systematic sample of 40 names is needed. Describe how to take it.
Show the solutionHide the solution
- 1 Interval \(800 \div 40 = 20\)
- 2 Random start Pick a random number from 1 to 20, e.g. 7
- 3 Then Take every 20th name: 7, 27, 47, and so on
AnswerChoose a random start between 1 and 20, then take every 20th name.
Capture-Recapture (Higher)
50 fish are caught, tagged and released. Later, 40 fish are caught and 8 of them are tagged. Estimate the number of fish in the lake.
Show the solutionHide the solution
- 1 Proportion tagged in the second sample \(\dfrac{8}{40}\)
- 2 Set equal to the proportion tagged in the lake \(\dfrac{8}{40} = \dfrac{50}{N}\)
- 3 Rearrange \(N = \dfrac{50 \times 40}{8} = 250\)
AnswerThere are about 250 fish in the lake.
Bias
A sample is biased if some members are more likely to be chosen than others.
-
Where you ask
Asking only people at a football match about sport is biased.
-
Who answers
Only those who reply to an online poll may hold stronger views.
-
Sample too small
Small samples can be unrepresentative just by chance.
-
Fix it
Use a random method and a large enough sample.
Fair or Biased?
Decide whether each sample is fair or biased and explain why. (a) Asking 20 people leaving a gym how much they exercise. (b) Choosing 30 pupils at random from the register. (c) Asking the first 10 people to arrive at school about school start times.
1. Ask who might be missing.
2. Suggest a fairer method.
A good answer shows: (a) Biased: gym users exercise more than most people. (b) Fair: random. (c) Biased: early arrivals may have different views (for example they may travel by bus).
Can I...?
- 1Define population and sample.
- 2Spot bias.
- 3Take a random sample.
- 4Take a systematic sample.
- 5Work out a stratified sample.
- 6Explain why bigger is better.
- 7Use capture-recapture.
- 8Give a reason for my choice.
Summary & Exam Focus
- Sample = part of the population.
- Random samples avoid bias.
- Stratified: number in each group \(= \dfrac{\text{group}}{\text{population}} \times \text{sample size}\).
- Capture-recapture: \(N = \dfrac{\text{first} \times \text{second}}{\text{tagged in second}}\).
Exam focus
A school has 200 pupils in Year 9, 160 in Year 10 and 240 in Year 11. Alex takes a stratified sample of 60 pupils. How many pupils should he take from each year? (3 marks) (3 marks)
Find the fraction sampled, then multiply each group by it.
Key terms
The vocabulary this lesson expects you to use. Each one is linked from the first place it appears above.
- Population
- The whole group you want to know about.
- Sample
- A smaller group taken from the population.
- Bias
- Unfairness that makes a sample unrepresentative.
- Random sample
- Every member has an equal chance of selection.
- Stratified sample
- A sample split into groups in proportion to the population.
- Capture-recapture
- A method to estimate the size of a wild population.
Practice questions
Have a go at each one before you open its answer.
-
Question 1 Work out 3 marks
A school has 200 pupils in Year 9, 160 in Year 10 and 240 in Year 11. Alex takes a stratified sample of 60 pupils. Work out how many pupils he should take from each year.
Show answerHide answer
Model answer
Year 9: 20; Year 10: 16; Year 11: 24.
Mark scheme
- \(\dfrac{60}{600}\) or equivalent — M1
- Any two correct — M1
- All three correct — A1
-
Question 2 Explain 2 marks
Priya wants to find out how much exercise pupils in her school do. She asks 20 pupils leaving the school gym. Give one reason why her sample may be biased.
Show answerHide answer
Model answer
The pupils at the gym probably exercise more than most pupils, so the sample is not representative of the whole school.
Mark scheme
- Reason linked to gym users — M1
- Not representative — C1
-
Question 3 Describe 2 marks
There are 900 pupils on a school register. Describe how to take a systematic sample of 60 pupils.
Show answerHide answer
Model answer
\(900 \div 60 = 15\). Choose a random start between 1 and 15, then take every 15th pupil on the list.
Mark scheme
- 15 — M1
- Random start and every 15th — A1
-
Question 4 Estimate 3 marks
60 fish are caught in a lake, tagged and put back. Later, 30 fish are caught and 5 of them are tagged. Estimate the number of fish in the lake.
Show answerHide answer
Model answer
\(\dfrac{5}{30} = \dfrac{60}{N}\), so \(N = 360\).
Mark scheme
- \(\dfrac{5}{30} = \dfrac{60}{N}\) — M1
- \(\dfrac{60 \times 30}{5}\) — M1
- 360 — A1
-
Question 5 Give a reason 2 marks
Sam takes a random sample of 10 people to find the mean height of adults in a town. Give one way he could improve his sample.
Show answerHide answer
Model answer
Use a larger sample, still chosen at random, so it is more likely to represent the town.
Mark scheme
- Larger sample — M1
- Random or representative — A1
-
Question 6 Work out 3 marks
A club has 30 boys and 20 girls. A stratified sample of 10 members is taken. Work out how many boys and how many girls are in the sample.
Show answerHide answer
Model answer
6 boys and 4 girls.
Mark scheme
- \(\dfrac{10}{50}\) or \(\tfrac{1}{5}\) — M1
- 6 — A1
- 4 — A1
Quick check
-
A sample is biased if...
Show answerHide answer
C: It does not represent the population fairly
Some members are more likely to be chosen than others.
-
In a stratified sample, the number from each group is...
Show answerHide answer
B: In proportion to the group size
In proportion to the size of the group.
-
A systematic sample of 20 from 400 uses every...
Show answerHide answer
D: 20th
\(400 \div 20 = 20\), so every 20th.
-
Which is a random method?
Show answerHide answer
A: Random number generator
A random number generator gives every member an equal chance.
-
20 fish tagged; a second sample of 10 has 2 tagged. The estimate is...
Show answerHide answer
C: 100
\(20 \times 10 \div 2 = 100\).
-
A larger random sample is usually...
Show answerHide answer
B: More reliable
More reliable, because it is more likely to represent the population.
Downloads
Free to keep, print and annotate.
Something here looks wrong?
Tell us what and we will go and look. It goes to whoever writes these pages, nobody else, and we do not ask who you are — so there is nothing to sign and nothing comes back to you.