Viewing as
Teacher view: planning notes, the answers to every question, and the teacher copies of the files.
Business · Putting a business idea into practice
Break-even analysis
A business breaks even when its revenue exactly covers its costs. Break-even analysis tells an owner how much they must sell before making a profit, how safe their sales are, and what happens when prices or costs change.
Teacher resources
The teacher copies: slides with the questions built in, the answers, and anything else attached to this lesson for whoever is teaching it.
- Break-even analysis - Teacher Slides.pptx Teacher The lesson slides with the teacher's notes on each slide, and every question and mark scheme built in. Built from the lesson script on 25 September 2026. View
- Break-even analysis - Teacher Notes.docx Teacher The complete notes with the teacher's notes and every model answer in full. Built from the lesson script on 25 September 2026. View
Student handouts
The same files the students see, to print or hand out.
- Break-even analysis.pptx Built from the lesson script on 25 September 2026. View
- Break-even analysis - Completed Notes.docx The full notes for the lesson, to revise from. Built from the lesson script on 25 September 2026. View
- Break-even analysis - Exam Questions.docx Built from the lesson script on 25 September 2026. View
Last Lesson
Answer from memory before the answers appear.
-
How do you calculate revenue?
Price × quantity sold.
-
How do you calculate total costs?
Fixed costs + (variable cost per unit × quantity).
-
How do you calculate profit?
Total revenue - total costs.
-
Give one example each of a fixed and a variable cost.
Fixed: rent, salaries, insurance. Variable: raw materials, packaging, stock.
Learning Objectives
- 1Explain what is meant by break-even.
- 2Calculate the break-even level of output.
- 3Calculate and explain the margin of safety.
- 4Read profit, loss and break-even from a break-even diagram.
- 5Explain the impact of changes in revenue and costs on break-even.
What Is Break-Even?
Break-even is the point where total revenue equals total costs - no profit and no loss.
-
Break-even output
The number of units a business must sell to cover all its costs.
-
Below break-even
Every unit short of break-even means the business makes a loss.
-
Above break-even
Every unit sold beyond break-even adds to profit.
-
Why it matters
It tells a new business how much it must sell before it makes any money, and helps owners and banks judge whether an idea is realistic.
Calculating Break-Even
Break-even output = fixed costs ÷ (sales price - variable cost per unit).
-
Sales price - variable cost
The amount each unit contributes towards paying the fixed costs.
-
Fixed costs
The costs that must be covered before any profit is made.
-
The answer
Is always in units, not pounds. Round up to a whole unit if needed - you cannot sell part of a product.
The Café's Break-Even Point
Write the formula first, then put in the numbers.
The café sells coffee at £4. Each cup costs £1.50 to make, and fixed costs are £6,000 a month. Calculate how many cups it must sell to break even.
- 1 Write the formula Break-even = fixed costs ÷ (sales price - variable cost per unit)
- 2 Price - variable cost £4.00 - £1.50 = £2.50 per cup
- 3 Divide fixed costs £6,000 ÷ £2.50 = 2,400
AnswerBreak-even = 2,400 cups a month
The Margin of Safety
Margin of safety = actual (or budgeted) sales - break-even output.
-
What it means
How far sales could fall before the business starts to make a loss.
-
A big margin
Is safer: sales can drop a long way before the business is in trouble.
-
A small margin
Is risky: a small fall in sales could push the business into a loss.
-
Example
The café sells 3,000 cups and breaks even at 2,400, so its margin of safety = 3,000 - 2,400 = 600 cups.
Reading a Break-Even Diagram
On a break-even diagram, fixed costs are a flat line because they do not change with output. Total costs start at the fixed costs and rise with every cup made. Total revenue starts at zero and rises faster. Where revenue crosses total costs, the business breaks even.
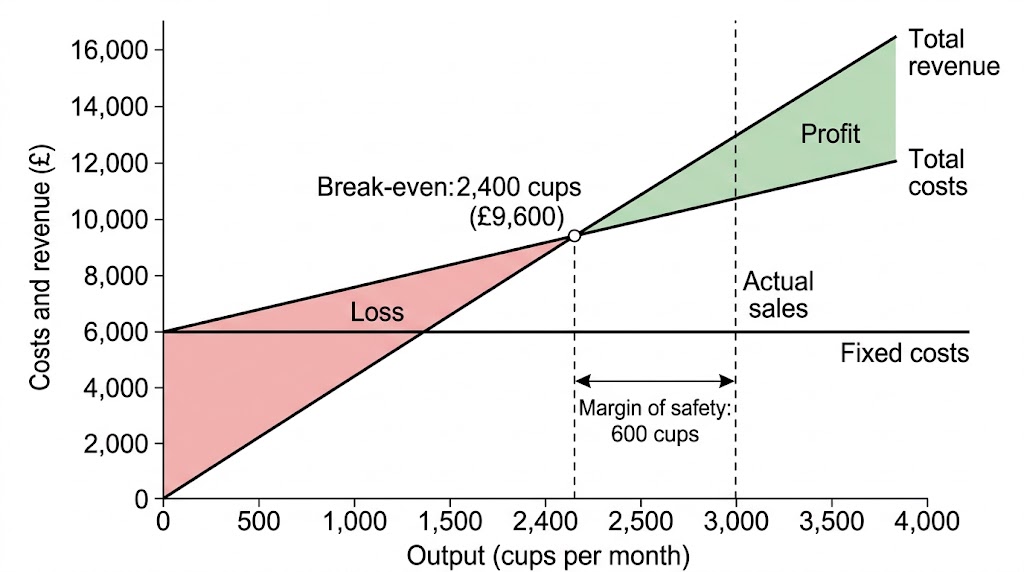
The café breaks even at 2,400 cups. At 3,000 cups its margin of safety is 600 cups.
What Each Part of the Diagram Shows
-
Fixed costs line
What it shows: Costs that do not change with output. Where to find it: Flat, horizontal line
-
Total costs line
What it shows: Fixed costs + variable costs. Where to find it: Starts at the fixed costs line, slopes up
-
Total revenue line
What it shows: Money from sales. Where to find it: Starts at zero, slopes up more steeply
-
Break-even point
What it shows: Revenue = total costs. Where to find it: Where the revenue and total costs lines cross
-
Loss
What it shows: Costs are greater than revenue. Where to find it: Gap between the lines, left of break-even
-
Profit
What it shows: Revenue is greater than costs. Where to find it: Gap between the lines, right of break-even
-
Margin of safety
What it shows: How far sales can fall before a loss. Where to find it: Gap between actual sales and break-even output
How Changes Affect the Café's Break-Even
-
Nothing changes
New calculation: £6,000 ÷ (£4.00 - £1.50). New break-even: 2,400 cups. Effect: The starting point
-
Price rises to £4.50
New calculation: £6,000 ÷ (£4.50 - £1.50). New break-even: 2,000 cups. Effect: Falls: better
-
Fixed costs rise to £7,500
New calculation: £7,500 ÷ (£4.00 - £1.50). New break-even: 3,000 cups. Effect: Rises: worse
-
Variable cost rises to £2.00
New calculation: £6,000 ÷ (£4.00 - £2.00). New break-even: 3,000 cups. Effect: Rises: worse
What Moves the Break-Even Point?
Break-even FALLS (good)
- Selling price rises.
- Fixed costs fall.
- Variable cost per unit falls.
- The business needs to sell fewer units to cover its costs.
- The margin of safety grows.
Break-even RISES (bad)
- Selling price falls.
- Fixed costs rise.
- Variable cost per unit rises.
- The business needs to sell more units to cover its costs.
- The margin of safety shrinks.
Limitations of Break-Even Analysis
Break-even is useful, but it rests on assumptions.
-
Assumes everything is sold
In reality some stock may be left unsold or wasted.
-
Assumes prices and costs stay the same
Suppliers raise prices, and businesses offer discounts.
-
Only as good as its figures
If the estimates of sales or costs are wrong, so is the break-even point.
-
Does not show cash
A business can be above break-even and still run out of cash.
Break-Even Challenge
A candle maker sells candles at £12. Each candle costs £4 in wax, wicks and jars, and fixed costs are £1,600 a month. Calculate the break-even output. She sells 300 candles a month - calculate her margin of safety. Then work out the new break-even output if she raises her price to £14.
1. Calculate price - variable cost.
2. Calculate break-even output.
3. Calculate the margin of safety.
4. Recalculate at the new price.
A good answer shows: Break-even 200 candles; margin of safety 100 candles; new break-even 160 candles at £14.
Can I...?
- 1Explain what break-even means.
- 2Calculate break-even output.
- 3Calculate the margin of safety.
- 4Label a break-even diagram.
- 5Read break-even, profit and loss from a diagram.
- 6Explain the effect of a price change.
- 7Explain the effect of a change in costs.
- 8Explain the limitations of break-even.
Summary & Exam Focus
- Break-even output = fixed costs ÷ (sales price - variable cost per unit).
- Margin of safety = actual sales - break-even output.
- On a diagram, break-even is where total revenue crosses total costs.
- Higher prices or lower costs lower the break-even point; lower prices or higher costs raise it.
Exam focus
Calculate the break-even output for a business with fixed costs of £12,000, a selling price of £20 and variable costs of £8 per unit. (2 marks) (2 marks)
Always subtract the variable cost from the price before dividing. Your answer is in units, not pounds.
Key terms
The vocabulary this lesson expects you to use. Each one is linked from the first place it appears above.
- Break-even
- The point where total revenue equals total costs, so there is no profit and no loss.
- Break-even output
- The number of units a business must sell to cover its costs.
- Margin of safety
- The difference between actual sales and break-even output.
- Break-even diagram
- A graph showing fixed costs, total costs and total revenue, and where they cross.
Questions and answers
9 questions set on this lesson, with the mark schemes and model answers open.
Define the term 'margin of safety'.
Mark scheme — 1 mark available
- Actual / budgeted sales minus break-even output — 1 mark
Model answer
The difference between a business's actual sales and its break-even level of output.
A business has fixed costs of £12,000. It sells its product for £20 and the variable cost is £8 per unit. Calculate the break-even level of output. You are advised to show your working.
Mark scheme — 2 marks available
- Correct method: fixed costs ÷ (price - variable cost per unit) — 1 mark
- Correct answer: 1,000 units — 1 mark (award 2 marks for the correct answer with no working)
Model answer
£12,000 ÷ (£20 - £8) = £12,000 ÷ £12 = 1,000 units
The same business sells 1,300 units. Using your answer above, calculate its margin of safety. You are advised to show your working.
Mark scheme — 2 marks available
- Correct method: actual sales - break-even output — 1 mark
- Correct answer: 300 units — 1 mark (own figure rule applies)
Model answer
1,300 - 1,000 = 300 units
Outline one benefit to a new business of calculating its break-even output.
Mark scheme — 2 marks available
- A benefit identified, e.g. sets a sales target / shows if the idea is viable / helps get a loan — 1 mark
- Developed: why this helps the business — 1 mark
Model answer
It shows the owner how many units they must sell to avoid a loss (1), so they can judge whether their sales target is realistic before spending money on the business (1).
Explain one impact on a business's break-even output of an increase in the variable cost per unit.
Mark scheme — 3 marks available
- An impact identified: break-even output rises — 1 mark
- First linked point of explanation — 1 mark
- Second linked point of explanation — 1 mark
Model answer
The break-even output will rise (1). Each unit sold now contributes less towards paying the fixed costs, because the gap between price and variable cost is smaller (1). This means the business must sell more units before it covers its costs, and its margin of safety falls (1).
At the break-even point, a business makes:
Why: At break-even total revenue equals total costs, so there is neither a profit nor a loss.
Fixed costs are £3,000, price is £10 and variable cost is £4 per unit. What is break-even output?
Why: £3,000 ÷ (£10 - £4) = £3,000 ÷ £6 = 500 units.
What happens to break-even output if a business raises its selling price?
Why: Each unit now contributes more towards fixed costs, so fewer units are needed to break even.
On a break-even diagram, which line is horizontal?
Why: Fixed costs do not change with output, so the fixed costs line is flat.