Viewing as
Teaching this? The teacher view adds 2 files, the mark schemes and the model answers.
Maths · Probability
Experimental probability
Estimate probabilities from experiments using relative frequency, predict how many times an event will happen, and judge whether a coin or dice is fair.
Warm-up
Answer each one, then check.
-
1
Simplify \(\dfrac{30}{120}\).
Show answerHide answer
\(\dfrac{1}{4}\)
-
2
Write \(\dfrac{18}{60}\) as a decimal.
Show answerHide answer
0.3
-
3
What is the theoretical probability of heads on a fair coin?
Show answerHide answer
\(\dfrac{1}{2}\)
-
4
Work out \(500 \times 0.3\).
Show answerHide answer
150
-
5
What is \(\dfrac{1}{6}\) as a decimal, to 2 decimal places?
Show answerHide answer
0.17
Learning Objectives
- 1Work out relative frequency.
- 2Use relative frequency to estimate probability.
- 3Predict how many times an event will happen.
- 4Decide whether a coin, dice or spinner is fair.
RELATIVE FREQUENCY
Relative frequency is the number of times an event happens divided by the total number of trials.
\(\text{relative frequency} = \dfrac{\text{frequency of the event}}{\text{total number of trials}}\)
Relative Frequency Settles Down
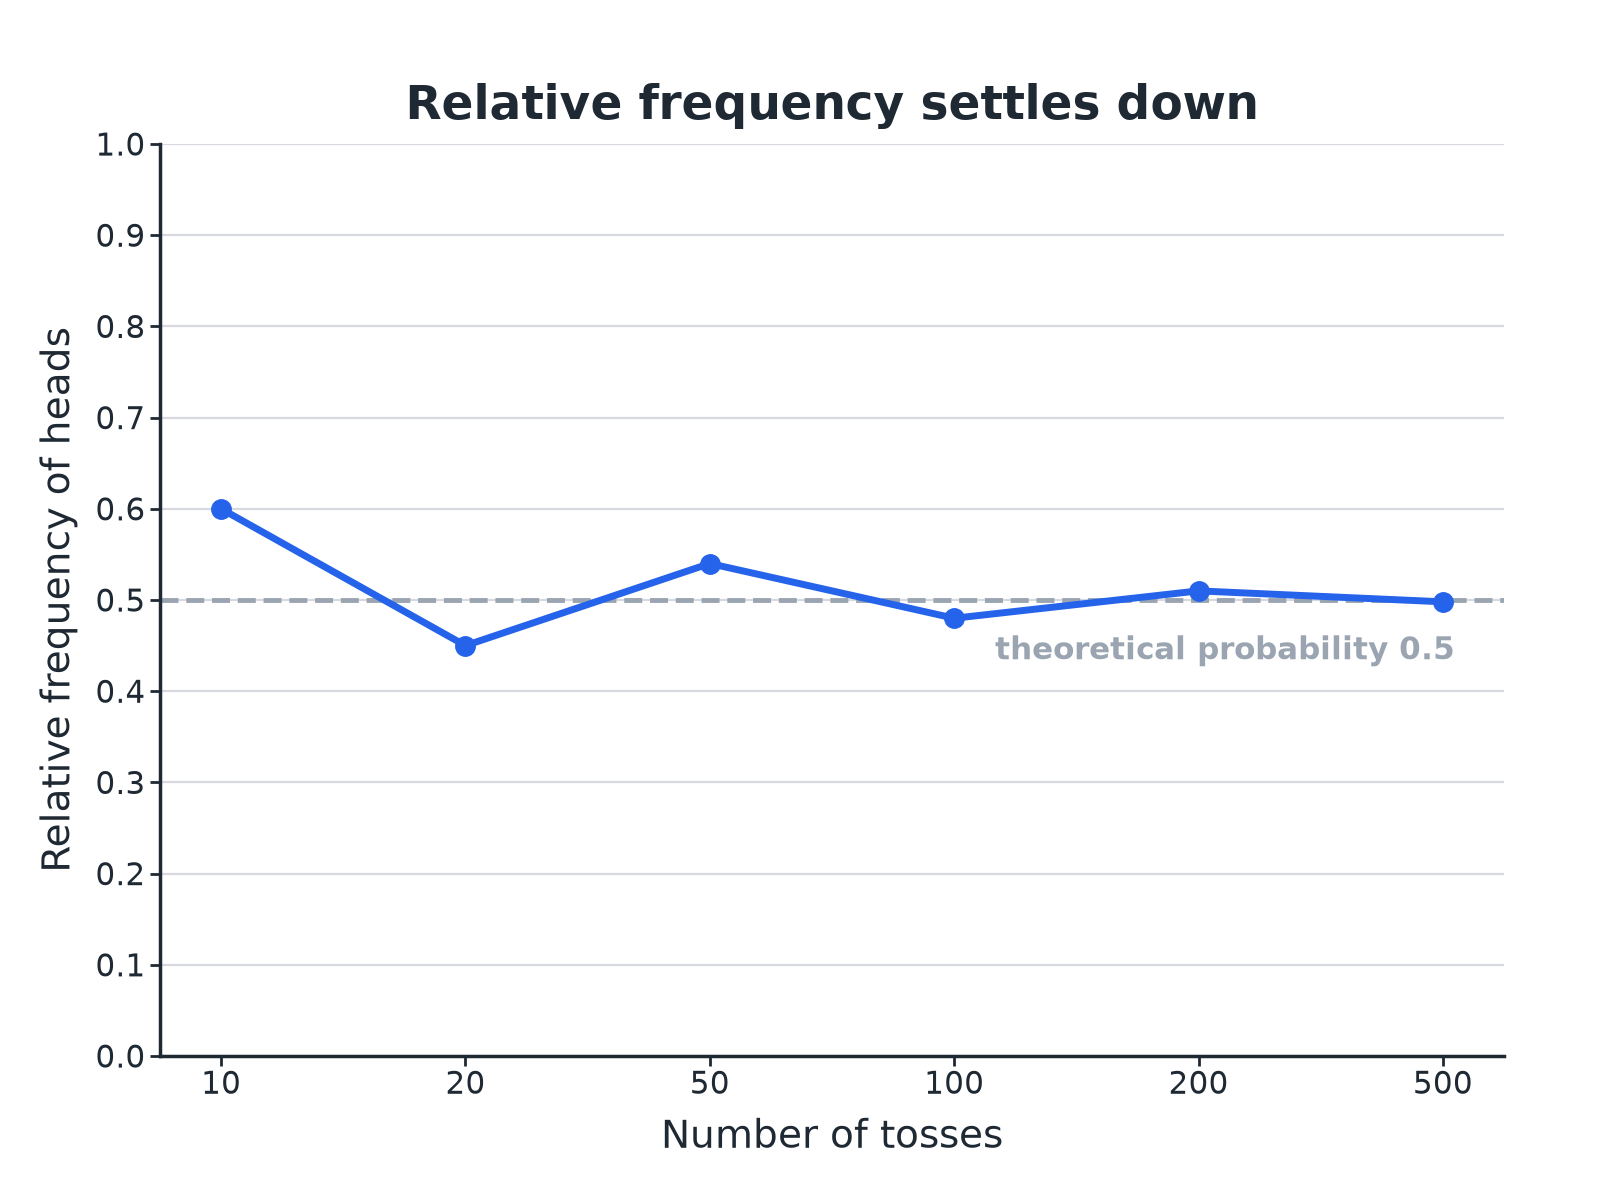
The more trials, the closer the relative frequency gets to the true probability.
Relative Frequency
A spinner is spun 60 times. It lands on red 18 times, blue 30 times and green 12 times. Find the relative frequency of each colour.
Show the solutionHide the solution
- 1 Red \(\dfrac{18}{60} = 0.3\)
- 2 Blue \(\dfrac{30}{60} = 0.5\)
- 3 Green \(\dfrac{12}{60} = 0.2\)
AnswerRed 0.3, blue 0.5, green 0.2. These add up to 1.
Predicting Outcomes
Use the spinner results to estimate how many times you would expect blue in 500 spins.
Show the solutionHide the solution
- 1 Estimated probability of blue 0.5
- 2 Multiply by the number of spins \(0.5 \times 500 = 250\)
AnswerAbout 250 blues.
Is the Dice Fair?
A dice is rolled 120 times and lands on 6 a total of 30 times. Does this suggest the dice is biased?
Show the solutionHide the solution
- 1 Relative frequency of a 6 \(\dfrac{30}{120} = 0.25\)
- 2 Expected for a fair dice \(\dfrac{1}{6} = 0.167\), so about 20 sixes
- 3 Compare 30 is much bigger than 20
AnswerThe relative frequency 0.25 is well above \(\dfrac{1}{6}\), which suggests the dice may be biased, but more trials would give a more reliable conclusion.
Theoretical or Experimental?
Theoretical probability
- Worked out from equally likely outcomes.
- Example: \(P(\text{head}) = \dfrac{1}{2}\).
- Does not change.
Experimental probability
- Estimated from the results of trials.
- Example: 18 heads in 40 tosses gives 0.45.
- Changes as you do more trials.
How Reliable Is an Estimate?
More trials give better estimates.
-
Small samples
10 tosses might give 7 heads: 0.7 is a poor estimate of 0.5.
-
Large samples
1000 tosses will usually give a relative frequency very close to 0.5.
-
Fair
A fair dice or coin should give relative frequencies close to the theoretical values.
Coin Toss Experiment
Toss a coin 10 times and record the number of heads. Combine class results in groups of 10, 50 and 100 tosses. Work out the relative frequency of heads for each total and comment on how close each is to 0.5.
1. Collect results.
2. Combine.
3. Compare.
A good answer shows: Small groups vary widely (for example 3 or 7 heads out of 10), while the combined class total is very close to 0.5. This shows that relative frequency settles as the number of trials grows.
Can I...?
- 1Work out relative frequency.
- 2Use it as an estimate of probability.
- 3Work out an expected number.
- 4Compare experimental and theoretical results.
- 5Say whether a dice looks fair.
- 6Explain why more trials are better.
- 7Show relative frequencies add to 1.
- 8Draw a relative frequency graph.
Summary & Exam Focus
- Relative frequency \(= \dfrac{\text{frequency}}{\text{trials}}\).
- Expected number \(=\) probability \(\times\) trials.
- More trials give a more reliable estimate.
- Compare with the theoretical probability to test fairness.
Exam focus
A spinner is spun 200 times. It lands on red 62 times. Work out an estimate for the probability that it lands on red, and how many reds you expect in 500 spins. (3 marks) (3 marks)
Relative frequency is frequency divided by the number of trials. Multiply by the number of spins for the expected number.
Key terms
The vocabulary this lesson expects you to use. Each one is linked from the first place it appears above.
- Trial
- One repeat of an experiment.
- Frequency
- How many times an outcome happens.
- Relative frequency
- Frequency divided by the number of trials.
- Theoretical probability
- The probability worked out from equally likely outcomes.
- Expected number
- Probability multiplied by the number of trials.
- Fair
- Every outcome is equally likely.
Practice questions
Have a go at each one before you open its answer.
-
Question 1 Calculator 2 marks
A spinner is spun 60 times. It lands on red 18 times. Work out the relative frequency of red.
Show answerHide answer
Model answer
\(\dfrac{18}{60} = 0.3\).
Mark scheme
- \(\dfrac{18}{60}\) — M1
- 0.3 — A1
-
Question 2 Calculator 3 marks
A spinner is spun 200 times. It lands on red 62 times. Work out an estimate for the number of times it will land on red in 500 spins.
Show answerHide answer
Model answer
The relative frequency is \(\dfrac{62}{200} = 0.31\). The expected number is \(0.31 \times 500 = 155\).
Mark scheme
- \(\dfrac{62}{200}\) — M1
- \(0.31 \times 500\) — M1
- 155 — A1
-
Question 3 Calculator 3 marks
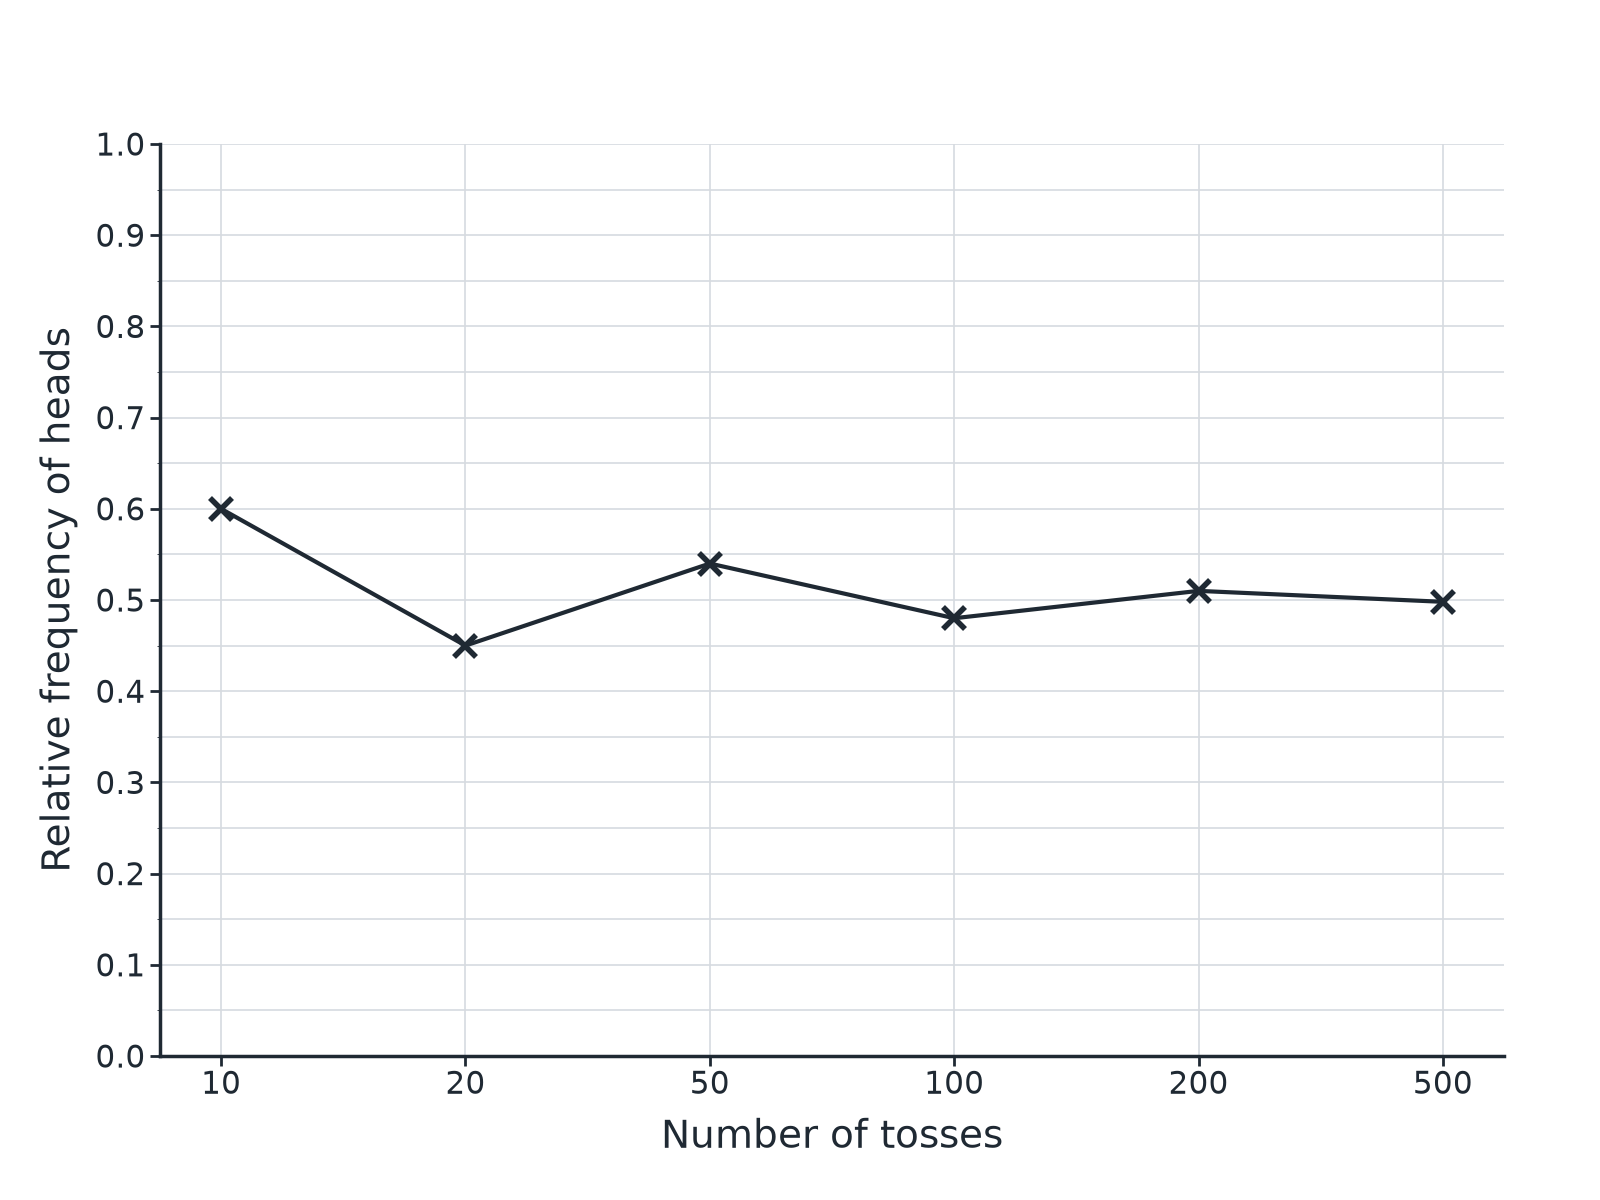
The graph shows the relative frequency of heads as a coin is tossed more and more times. Use it to explain whether the coin is likely to be fair.
Show answerHide answer
Model answer
The relative frequency gets close to 0.5 as the number of tosses increases, so the coin is likely to be fair.
Mark scheme
- The relative frequency settles — M1
- It is near 0.5 — M1
- Conclusion that the coin is likely to be fair — C1
-
Question 4 Calculator 3 marks
A dice is rolled 120 times. It lands on 6 a total of 30 times. Kim says the dice is biased. Is she right? You must show working.
Show answerHide answer
Model answer
The relative frequency of a 6 is \(\dfrac{30}{120} = 0.25\), compared with \(\dfrac{1}{6} \approx 0.17\) for a fair dice. The expected number of sixes is 20. 30 is much higher, so the dice may be biased, but more trials would make the conclusion more reliable.
Mark scheme
- \(\dfrac{30}{120} = 0.25\) or expected 20 — M1
- Comparison with \(\dfrac{1}{6}\) or 20 — M1
- A conclusion with a reason — C1
-
Question 5 Calculator 3 marks
The probability that a bus is late is 0.15. Work out the expected number of late buses in 200 journeys.
Show answerHide answer
Model answer
\(0.15 \times 200 = 30\).
Mark scheme
- \(0.15 \times 200\) — M1
- 30 — A1
- A sensible unit or statement — B1
-
Question 6 Explain 2 marks
Amy tosses a coin 10 times and gets 7 heads. Ben tosses the same coin 1000 times and gets 505 heads. Whose result gives a better estimate of the probability of a head? Give a reason.
Show answerHide answer
Model answer
Ben's result, because he did many more trials, so his relative frequency (0.505) is more reliable.
Mark scheme
- Ben — B1
- More trials give a more reliable estimate — C1
Quick check
-
A coin lands on heads 12 times in 30 tosses. What is the relative frequency of heads?
Show answerHide answer
B: 0.4
\(\dfrac{12}{30} = 0.4\).
-
The probability of rain is 0.2. How many rainy days do you expect in 100 days?
Show answerHide answer
C: 20
\(0.2 \times 100 = 20\).
-
Which gives a more reliable estimate of a probability?
Show answerHide answer
A: More trials
More trials give a better estimate.
-
Relative frequencies for all outcomes add up to...
Show answerHide answer
D: 1
They form a probability distribution, so they sum to 1.
-
A dice is fair. In 600 rolls, about how many sixes do you expect?
Show answerHide answer
B: 100
\(\dfrac{1}{6} \times 600 = 100\).
-
A coin gives 7 heads in 10 tosses. Is it definitely biased?
Show answerHide answer
C: No, more trials are needed
No: with only 10 trials, a result like this can easily happen by chance, so more trials are needed.
Downloads
Free to keep, print and annotate.
- Experimental probability.pptx Built from the lesson script on 30 September 2026. View
- Experimental probability - Completed Notes.docx The full notes for the lesson, to revise from. Built from the lesson script on 30 September 2026. View
- Experimental probability - Exam Questions.docx Built from the lesson script on 30 September 2026. View
Something here looks wrong?
Tell us what and we will go and look. It goes to whoever writes these pages, nobody else, and we do not ask who you are — so there is nothing to sign and nothing comes back to you.