Biology · Monitoring and Maintaining the Environment
Sampling Organisms: Quadrats and Transects
You cannot count every daisy on a school field, so ecologists count a small part of it and use that to describe the rest. This lesson is for both Combined Science and separate Biology. It covers how to sample the abundance and distribution of organisms with quadrats and transects, how to use other equipment and keys, and how to calculate a mean.
Learning Objectives
- 1Explain the meaning of abundance and distribution, and why ecologists sample a habitat instead of counting every organism.
- 2Describe how to carry out a field investigation using random sampling with quadrats, and systematic sampling along a transect.
- 3Describe the use of pooters, nets and keys in sampling and identifying organisms.
- 4Calculate a mean from sample data, and explain how to make the results of a field investigation reliable.
Retrieval practice
-
1
What is a habitat?
Show answerHide answer
The place where an organism lives.
-
2
What is a community?
Show answerHide answer
All of the populations of the different species that live in the same habitat.
-
3
What is an abiotic factor?
Show answerHide answer
A non-living factor of the environment, such as light, temperature or soil moisture.
-
4
How do you calculate a mean?
Show answerHide answer
Add up all of the values and divide by the number of values.
Why sample?
To find out how many daisies grow on a field, or where in a woodland a species of beetle lives, we cannot count every individual. There are too many, they are moving, and counting would damage the habitat. Instead ecologists take samples, which are small parts of the habitat, count the organisms in them and use the results to estimate what is in the whole habitat. A sample is useful only if it is representative, which means it gives a true picture of the whole habitat.
Abundance and distribution
A field investigation usually answers one of two questions, and each one needs a different sampling method.
-
Abundance
How many individuals of a species live in an area, for example the number of daisies in every square metre. It can also be given as the percentage of the ground that the species covers.
-
Distribution
Where in the habitat a species is found, and how that changes, for example from the edge of a wood to the middle. Distribution is usually linked to a factor in the environment, such as light, moisture or pH.
-
Random sampling
Samples are taken at positions chosen by chance. It is used to estimate the abundance of a species in an area that looks the same all over.
-
Systematic sampling
Samples are taken at regular intervals along a line. It is used to find how the distribution of organisms changes across a habitat, where there is a gradient of an environmental factor.
Random sampling with quadrats
A quadrat is a square frame, often 0.5 m by 0.5 m, that marks off a known area. Its size is chosen to suit the organisms: small for grass, bigger for shrubs.
-
Why random
If you choose where to put the quadrat, you may choose the places with the most plants, or avoid the bare patches. This is bias. Random positions give every part of the area the same chance, so the sample is representative.
-
Abundance by counting
For plants that can be counted as separate individuals, such as daisies, count the number of individuals inside the quadrat.
-
Percentage cover
For plants that cannot be counted individually, such as grass or moss, estimate the percentage of the quadrat that the plant covers. If the frame has a grid of 25 squares, each square is 4 per cent.
-
A large enough sample
The more quadrats, the more reliable the mean. At least 10 are normally used, and more are better, because a few quadrats could be unusual by chance.
Method for random sampling of an area
This is the method that OCR expects you to be able to describe.
-
1
Mark out the area
Lay two long tape measures at right angles along two sides of the study area, to make a grid.
-
2
Choose random positions
Use a random number generator, or random number tables, to give pairs of coordinates, such as 6 m along and 4 m up.
-
3
Place the quadrat
At each pair of coordinates place the quadrat, and count the organisms of the species inside it, or estimate the percentage cover.
-
4
Repeat
Do this for at least 10 quadrats, and record the results in a table.
-
5
Calculate
Find the mean number of organisms per quadrat, and scale it up to the whole area, as described in the next lesson.
Random sampling with a quadrat
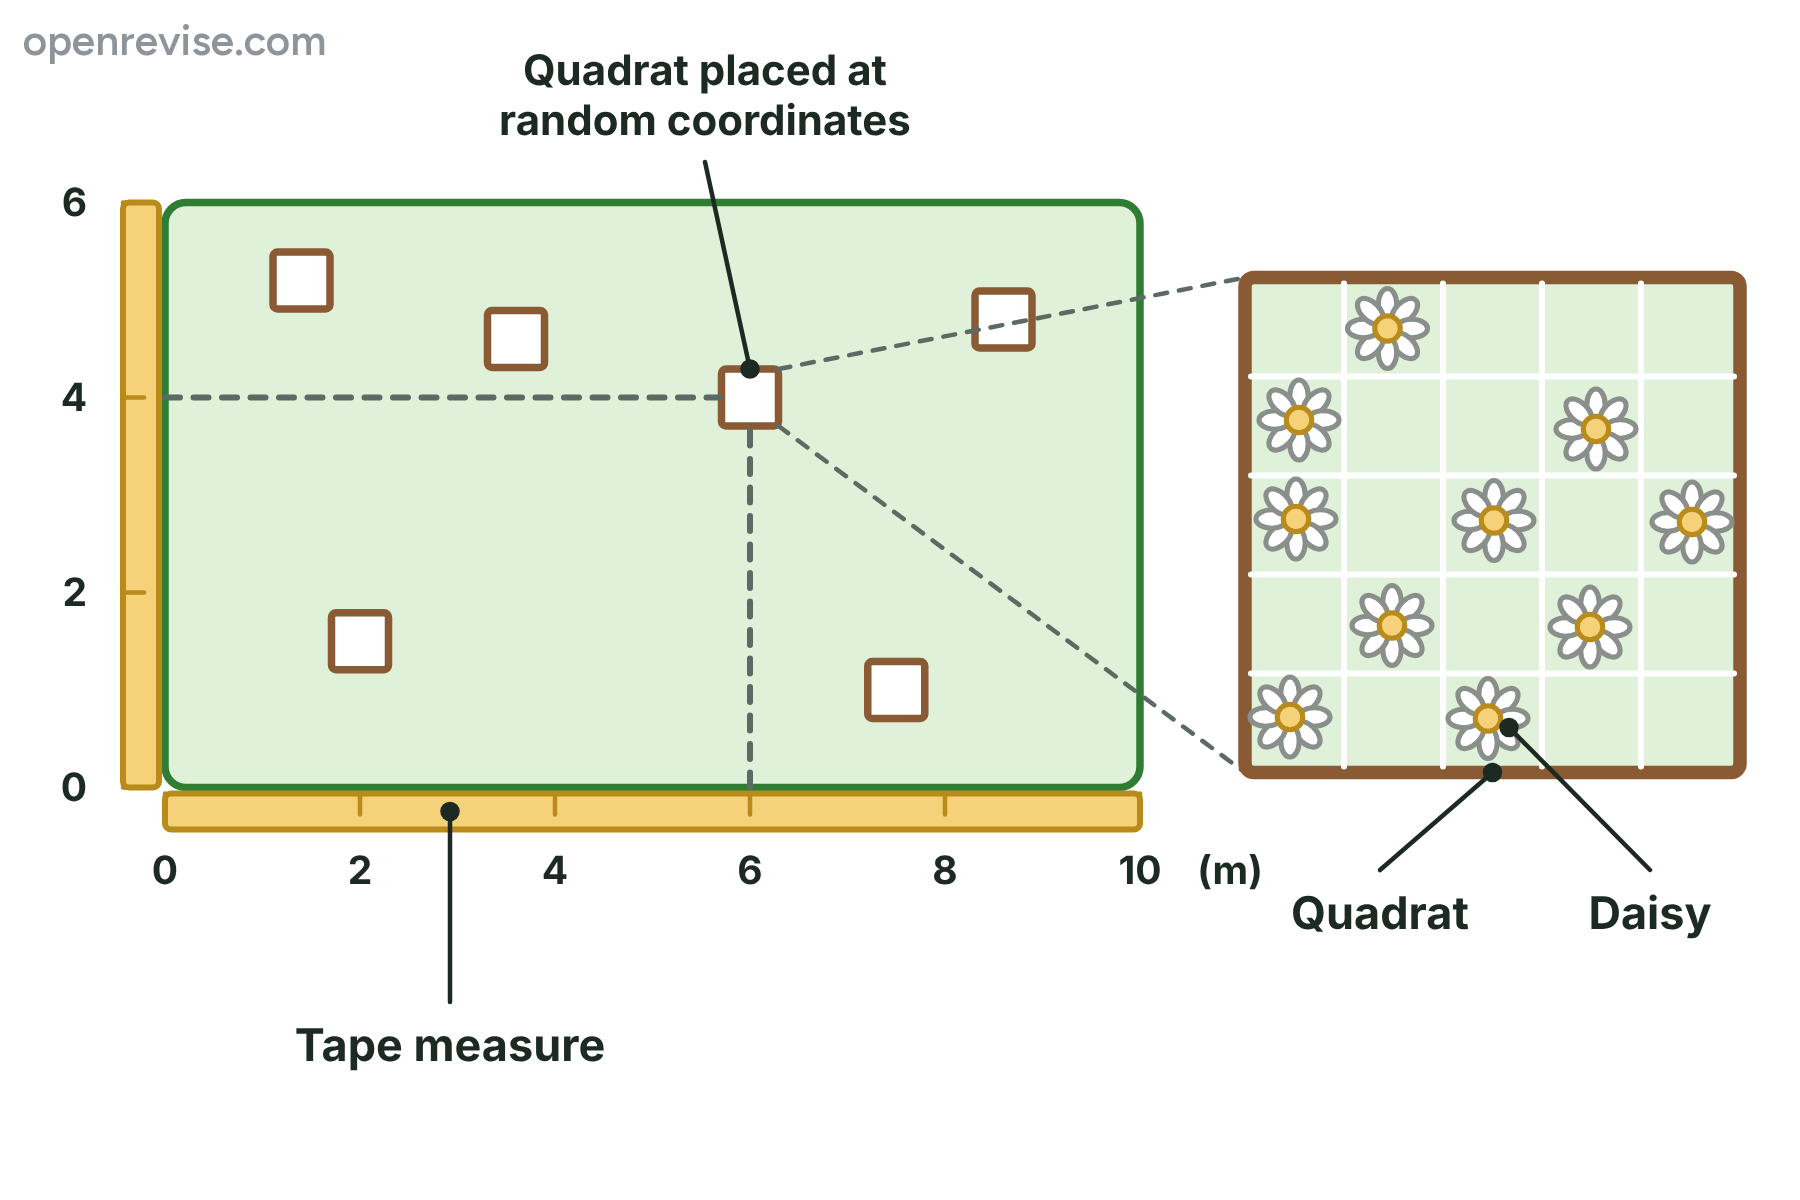
Random coordinates from a random number generator decide where each quadrat goes.
Transects: sampling along a line
A transect is used when the environment changes gradually across a habitat, and you want to know how the organisms change with it.
-
Laying the line
A tape measure is laid in a straight line across the habitat, for example from the shade of a hedge out into an open field, or from the top of a shore to the water.
-
Line transect
Every organism that touches the tape, or is directly under marked points on it, is recorded. It is quick, and it suits habitats in which organisms are large or few.
-
Belt transect
A quadrat is placed at regular intervals along the tape, such as every 2 m, and the organisms in each one are counted or the cover is estimated. It gives more detail.
-
Linking to the environment
At each point, measure an abiotic factor, such as light intensity, soil moisture or pH, with a meter. Then see whether the distribution of the species matches the change in the factor.
A belt transect from a hedge
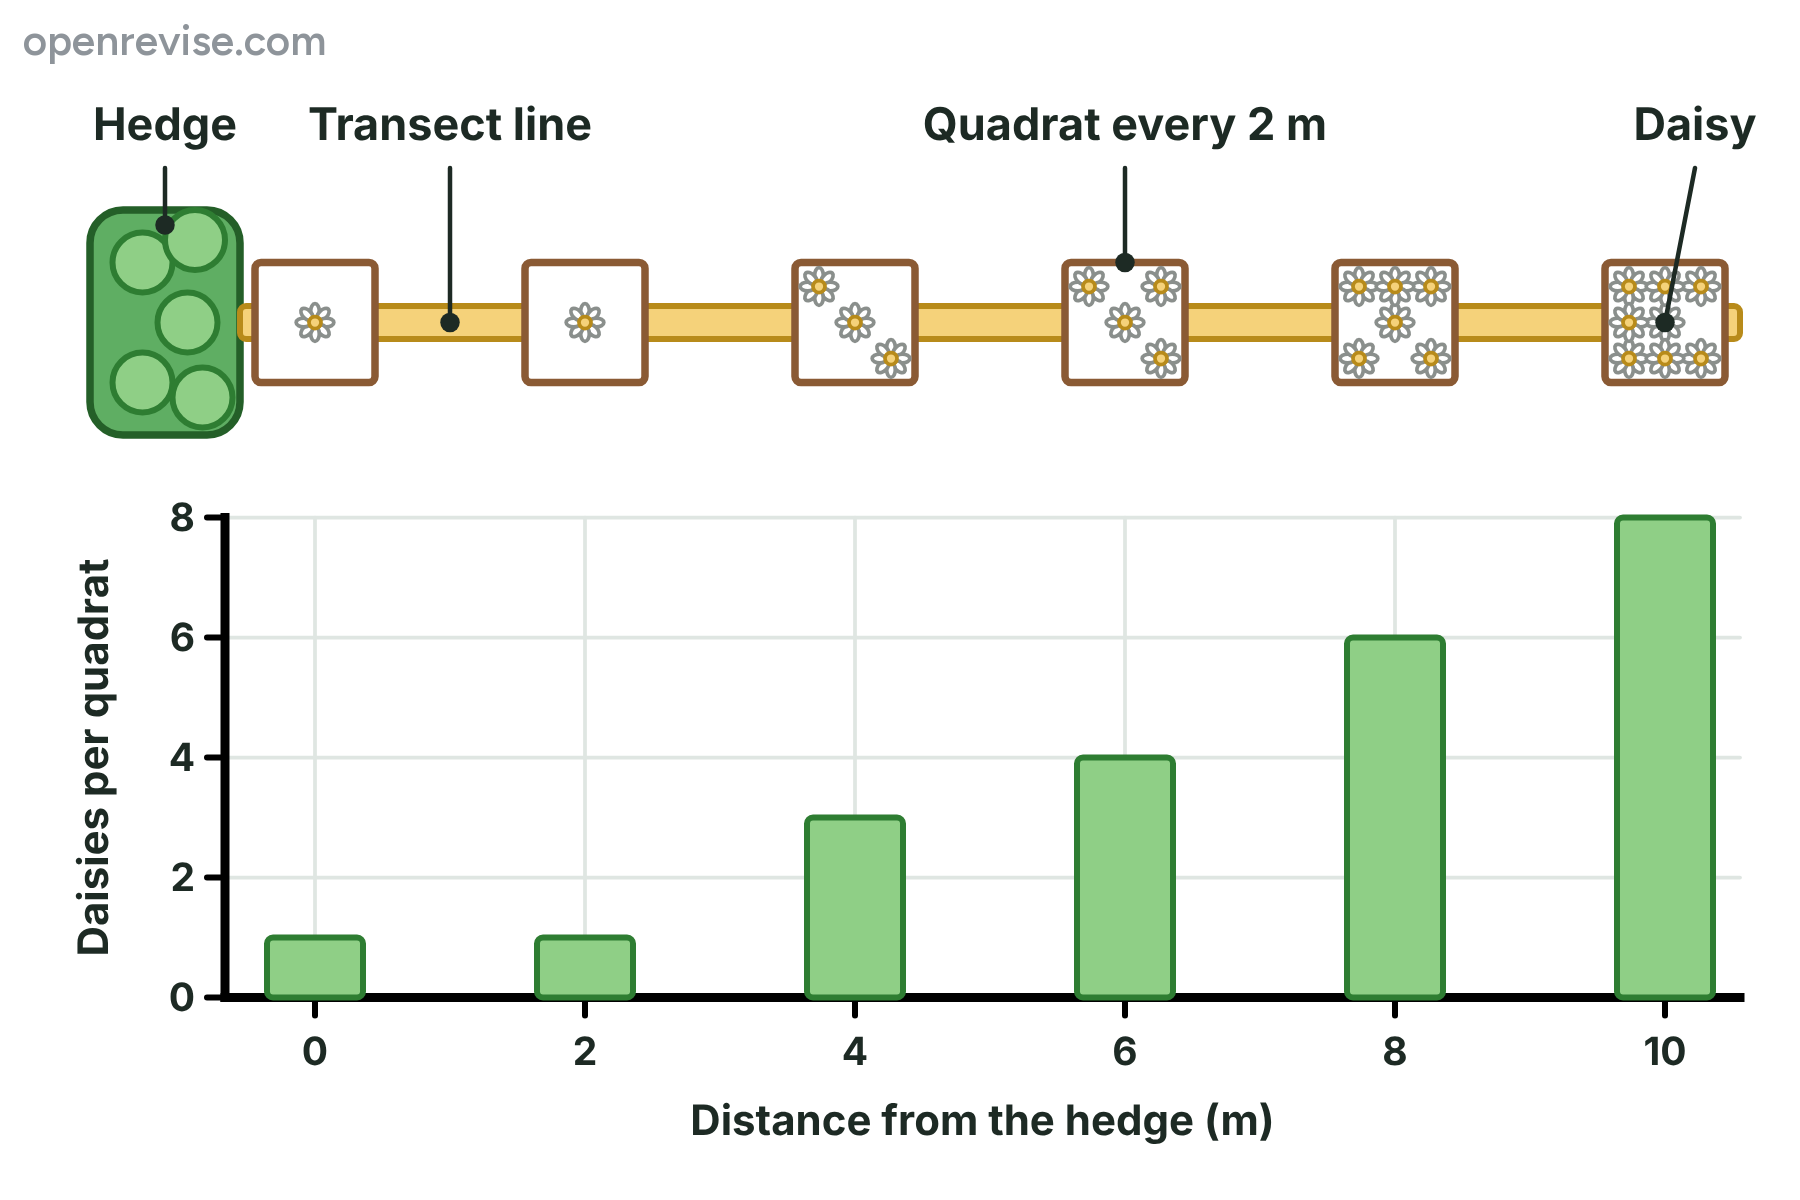
The number of daisies increases with distance from the hedge, which shows their distribution.
Random sampling and systematic sampling
Random sampling with quadrats
- Quadrats placed at random coordinates
- Shows the abundance of a species in an area
- Used when the habitat looks the same all over
- Avoids bias in choosing where to sample
Systematic sampling along a transect
- Samples at regular intervals along a line
- Shows how the distribution of a species changes
- Used when there is a gradient, such as light or moisture
- Can be linked to measurements of abiotic factors
Pooters, nets and keys
Quadrats are for plants and for animals that do not move. Other equipment is needed for small animals.
-
Pooter
A jar with two tubes. When you suck on the short tube, small insects are drawn up the other tube into the jar, without being harmed. A mesh over the end of the short tube stops you from breathing them in.
-
Sweep net
A strong net swept through long grass or low plants to catch insects and spiders. Pond nets and kick sampling in a stream are used to catch animals in water.
-
Pitfall trap
A pot buried with its rim level with the soil, which catches small animals that walk on the ground, such as beetles. It is covered to keep out the rain and checked often.
-
Identification key
A series of paired statements about features. At each step the animal fits one statement, which leads to another pair or to a name. It identifies the species that you have caught.
Using a key
Use this key to identify an animal that has no legs and a shell. 1a Has legs, go to 2. 1b No legs, go to 3. 2a Eight legs, spider. 2b Fourteen legs, woodlouse. 3a Has a shell, snail. 3b No shell, slug.
Show the solutionHide the solution
- 1 Start at 1 The animal has no legs, so statement 1b applies, and the key says to go to 3
- 2 Go to 3 The animal has a shell, so statement 3a applies
- 3 Read the name Statement 3a gives the name: snail
AnswerThe animal is a snail.
Calculating a mean
A student placed 10 quadrats at random in a field and counted the daisies in each. The counts were 4, 7, 3, 5, 6, 2, 8, 5, 4 and 6. Calculate the mean number of daisies per quadrat.
Show the solutionHide the solution
- 1 Add the counts \(4 + 7 + 3 + 5 + 6 + 2 + 8 + 5 + 4 + 6 = 50\)
- 2 Divide by the number of quadrats \(50 \div 10\)
- 3 Give the answer \(= 5.0\) daisies per quadrat
AnswerThe mean is 5.0 daisies per quadrat.
Making the results reliable
Good fieldwork controls the things that could make the results misleading.
-
Enough samples
Use many quadrats, so that unusual results have little effect on the mean. Look out for anomalies and check them.
-
The same method each time
Use the same size of quadrat and the same way of counting, and sample at the same time of day and season, so that the only thing that changes is what you are investigating.
-
Percentiles and averages
The mean gives the typical value. A percentile tells you the percentage of the results below a value, so the median is the 50th percentile, and if a count is at the 90th percentile then 90 per cent of the quadrats had fewer organisms.
-
Care for the habitat
Take samples without damaging the habitat, and put animals back where they were found. Wash hands afterwards.
The big idea
Sample by chance to estimate the abundance of a species, and sample along a line to show how its distribution changes.
Sampling organisms
Sampling organisms
-
Abundance
- number in an area
- percentage cover
- random quadrats
- calculate the mean
-
Distribution
- where organisms are found
- transect
- systematic sampling
- link to abiotic factors
-
Equipment
- quadrat
- tape measure
- pooter
- nets
- pitfall trap
- key
-
Reliable
- random positions
- enough quadrats
- same method
- control other factors
-
Maths
- mean
- percentage cover
- percentiles
- scaling up
Summary and exam focus
- Abundance is how many individuals of a species there are, and distribution is where in the habitat they are found.
- Random sampling with quadrats at random coordinates estimates abundance without bias, and a belt transect samples at regular intervals to show distribution.
- Pooters, nets and pitfall traps catch small animals, and identification keys name them.
- The mean is the sum of the values divided by the number of values, and a larger sample makes it more reliable.
- Results are made reliable by random positions, enough quadrats, the same method every time and control of other factors.
Exam focus
Describe how you would use quadrats to estimate the abundance of daisies in a school field. (4 marks) (4 marks)
Put the steps in order and be specific: mark a grid with two tape measures, use random numbers for the coordinates, place the quadrat and count the daisies, and repeat for at least 10 quadrats before calculating the mean. Say why: random positions avoid bias, and many quadrats make the result more reliable.
Key terms
The words this lesson expects you to use. Each one is linked from the first place it appears above.
- Abundance
- The number of individuals of a species in an area or habitat.
- Distribution
- Where in a habitat a species is found.
- Quadrat
- A square frame that marks off a known area for sampling.
- Transect
- A line across a habitat, along which samples are taken at regular intervals.
- Random sampling
- Taking samples at positions chosen by chance, to avoid bias.
- Systematic sampling
- Taking samples at regular intervals along a line.
- Pooter
- A device for collecting small insects by sucking them into a jar through a tube, without harming them.
- Percentage cover
- An estimate of the percentage of the ground in a quadrat that a species covers.
- Identification key
- A series of paired statements used to identify an organism from its features.
- Bias
- A systematic error that makes a sample unrepresentative.
- Sample
- A small part of a habitat or population that is studied, to represent the whole.
You've finished the notes
Check your understanding
Test yourself while it is fresh. Start with the flashcards, then try the exam questions.
Something here looks wrong?
Tell us what and we will go and look. It goes to whoever writes these pages, nobody else, and we do not ask who you are — so there is nothing to sign and nothing comes back to you.