Exam questions · Biology · Monitoring and Maintaining the Environment
Sampling Organisms: Quadrats and Transects
- 8 exam questions
- 23 marks
- 8 quick checks
-
1 Describe [2 marks]
Describe the difference between the abundance and the distribution of a species.
Show answerHide answer
Model answer
Abundance is the number of individuals of the species in an area. Distribution is where in the habitat the species is found.
Mark scheme
- Abundance is the number of individuals in an area — 1 mark
- Distribution is where the species is found — 1 mark
-
2 State [1 mark]
State the name of a piece of equipment that is used to collect small insects from plants without harming them.
Show answerHide answer
Model answer
A pooter.
Mark scheme
- A pooter — 1 mark
-
3 Describe [4 marks]
Describe how you would use quadrats to estimate the abundance of buttercups in a field.
Show answerHide answer
Model answer
Lay two tape measures at right angles to make a grid over the field. Use a random number generator to pick pairs of coordinates, and place a quadrat at each position. Count the buttercups in each quadrat. Repeat for at least ten quadrats and calculate the mean number of buttercups per quadrat.
Mark scheme
- Two tape measures to make a grid — 1 mark
- Random numbers used for the coordinates — 1 mark
- A quadrat placed at each position and the buttercups counted — 1 mark
- At least ten quadrats and the mean calculated — 1 mark
-
4 Calculate [2 marks]
A student counted the number of dandelions in six quadrats. The counts were 3, 0, 5, 2, 4 and 6. Calculate the mean number of dandelions per quadrat.
Show answerHide answer
Model answer
\(3 + 0 + 5 + 2 + 4 + 6 = 20\), and \(20 \div 6 = 3.3\) dandelions per quadrat to one decimal place.
Mark scheme
- \(20 \div 6\) — 1 mark
- 3.3 (3.33 accepted) — 1 mark
-
5 Explain [2 marks]
A student placed her quadrats in the places where there were the most plants. Explain why this is a poor method.
Show answerHide answer
Model answer
She has chosen the places, so the sample is biased. The quadrats are not representative of the whole area, so the abundance will be overestimated.
Mark scheme
- The sample is biased because she chose the places — 1 mark
- It is not representative, so the abundance is overestimated — 1 mark
-
6 Describe [3 marks]
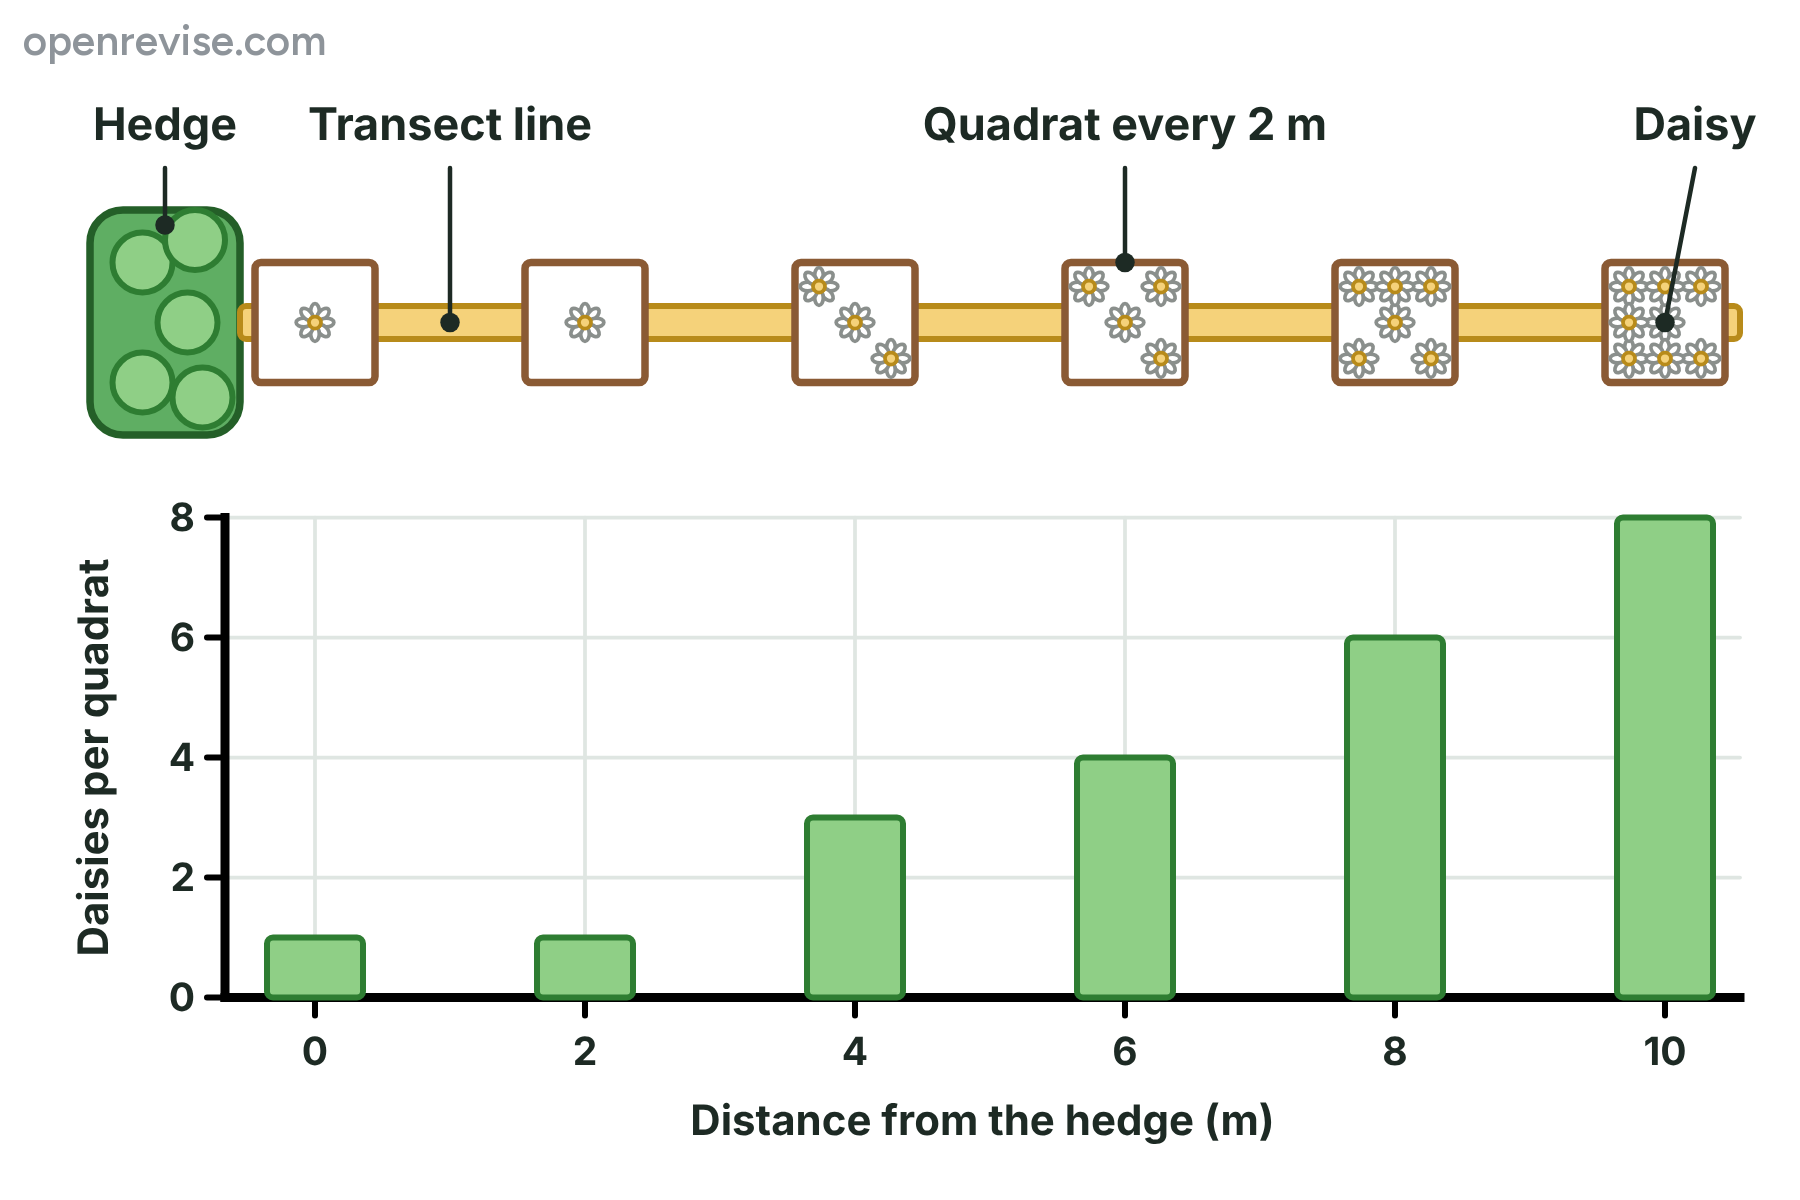
The diagram shows a belt transect from a hedge into a field. Describe the pattern shown by the results and suggest one reason for it.
Show answerHide answer
Model answer
The number of daisies per quadrat increases with distance from the hedge, from 1 at 0 m to 8 at 10 m. This may be because there is more light away from the hedge, as the hedge makes shade, or because the hedge takes water from the soil.
Mark scheme
- Number of daisies increases with distance from the hedge — 1 mark
- Uses data, such as 1 at 0 m and 8 at 10 m — 1 mark
- A suitable reason, such as less shade or more water — 1 mark
-
7 Explain [3 marks]
Explain why a student should use at least ten quadrats, rather than two, to estimate the abundance of a plant.
Show answerHide answer
Model answer
A small number of quadrats may be unusual by chance, for example by landing on a bare patch or a very crowded patch. With more quadrats, the unusual values have less effect on the mean. So the mean is more likely to be representative of the whole area, and the result is more reliable.
Mark scheme
- A few quadrats may be unusual by chance — 1 mark
- More quadrats reduce the effect of unusual results on the mean — 1 mark
- The mean is more representative of the area, so it is more reliable — 1 mark
-
8 Describe [6 marks]
A student thinks that the number of moss plants is greater in shaded parts of a lawn than in sunny parts. Describe how the student could investigate this. Include the equipment and how the results would be made reliable.
Show answerHide answer
Model answer
The student should choose a shaded area, for example under a tree, and a sunny area of lawn. In each area, tape measures are laid at right angles and random numbers are used for the coordinates of at least ten quadrats. A quadrat of the same size is used in both areas. Moss cannot be counted as separate plants, so the student estimates the percentage cover in each quadrat, using the grid of squares. A light meter is used at each quadrat to show that the light level is different. The mean percentage cover is calculated for each area and compared. To make the results reliable the quadrats are used in the same way, the work is done at the same time and the same person counts, and the investigation could be repeated on other lawns. The student should take care not to damage the plants.
Mark scheme
- Chooses a shaded area and a sunny area — 1 mark
- Random coordinates from a grid made with tape measures — 1 mark
- At least ten quadrats of the same size in each area — 1 mark
- Percentage cover estimated for moss — 1 mark
- Measures light intensity with a light meter — 1 mark
- Calculates and compares the means, with repeats or controlled variables — 1 mark
Quick check
-
1
What does the abundance of a species mean?
Show answerHide answer
B: The number of individuals in an area
Abundance is the number of individuals of a species in an area. Where they are found is the distribution.
-
2
Why are quadrats placed at random positions?
Show answerHide answer
D: To avoid bias
Random positions give every part of the area an equal chance, which avoids bias in the sample.
-
3
Which method is best for finding how the distribution of a species changes from the edge of a wood into a field?
Show answerHide answer
A: A transect
A transect samples at regular intervals along a line, so it shows how organisms change along an environmental gradient.
-
4
What is a pooter used for?
Show answerHide answer
C: Collecting small insects from plants
A pooter sucks small insects into a jar through a tube, without harming them.
-
5
A quadrat has 25 equal squares, and a plant covers 6 of them. What is its percentage cover?
Show answerHide answer
C: 24 per cent
Each square is 4 per cent, so 6 squares is 24 per cent (6 divided by 25, times 100).
-
6
Five quadrats contain 2, 4, 6, 6 and 7 plants. What is the mean number of plants per quadrat?
Show answerHide answer
B: 5.0
The total is 25, and 25 divided by 5 is 5 plants per quadrat.
-
7
Which of these makes a field investigation more reliable?
Show answerHide answer
D: Using a large number of quadrats
More quadrats reduce the effect of unusual results, so the mean is more reliable.
-
8
What is an identification key?
Show answerHide answer
A: A set of paired statements that leads to the name of an organism
A key is a series of paired statements about features, which leads to the name of an organism.