Flashcards · Biology · Monitoring and Maintaining the Environment
Sampling Organisms: Quadrats and Transects
-
What is abundance?
The number of individuals of a species in an area.
-
What is distribution?
Where in a habitat a species is found.
-
Why do ecologists take samples?
Counting every organism is impossible and may damage the habitat.
-
What is a quadrat?
A square frame that marks off a known area for counting.
-
Why are quadrats placed at random?
To avoid bias, so that the sample is representative of the area.
-
How are random positions chosen?
With a random number generator or random number tables, giving coordinates on a grid.
-
When do you use percentage cover instead of counting?
For plants that cannot be counted as individuals, such as grass or moss.
-
What is a transect?
A line laid across a habitat, along which samples are taken.
-
When is a transect used?
When there is a gradient in the environment, to show how the distribution of organisms changes.
-
Name two abiotic factors that could be measured along a transect.
Any two of light intensity, soil moisture, pH and temperature.
-
What is a pooter used for?
Collecting small insects by sucking them into a jar without harming them.
-
What does a pitfall trap catch?
Small animals that walk on the ground, such as beetles.
-
What is an identification key?
A set of paired statements that leads to the name of an organism.
-
How do you calculate a mean?
Add up the values and divide by the number of values.
-
Why use at least 10 quadrats?
The more quadrats there are, the less an unusual result affects the mean.
-
What is the 50th percentile?
The median, the value below which half of the results fall.
-
 Describe how this method is used to sample the abundance of a plant in a field.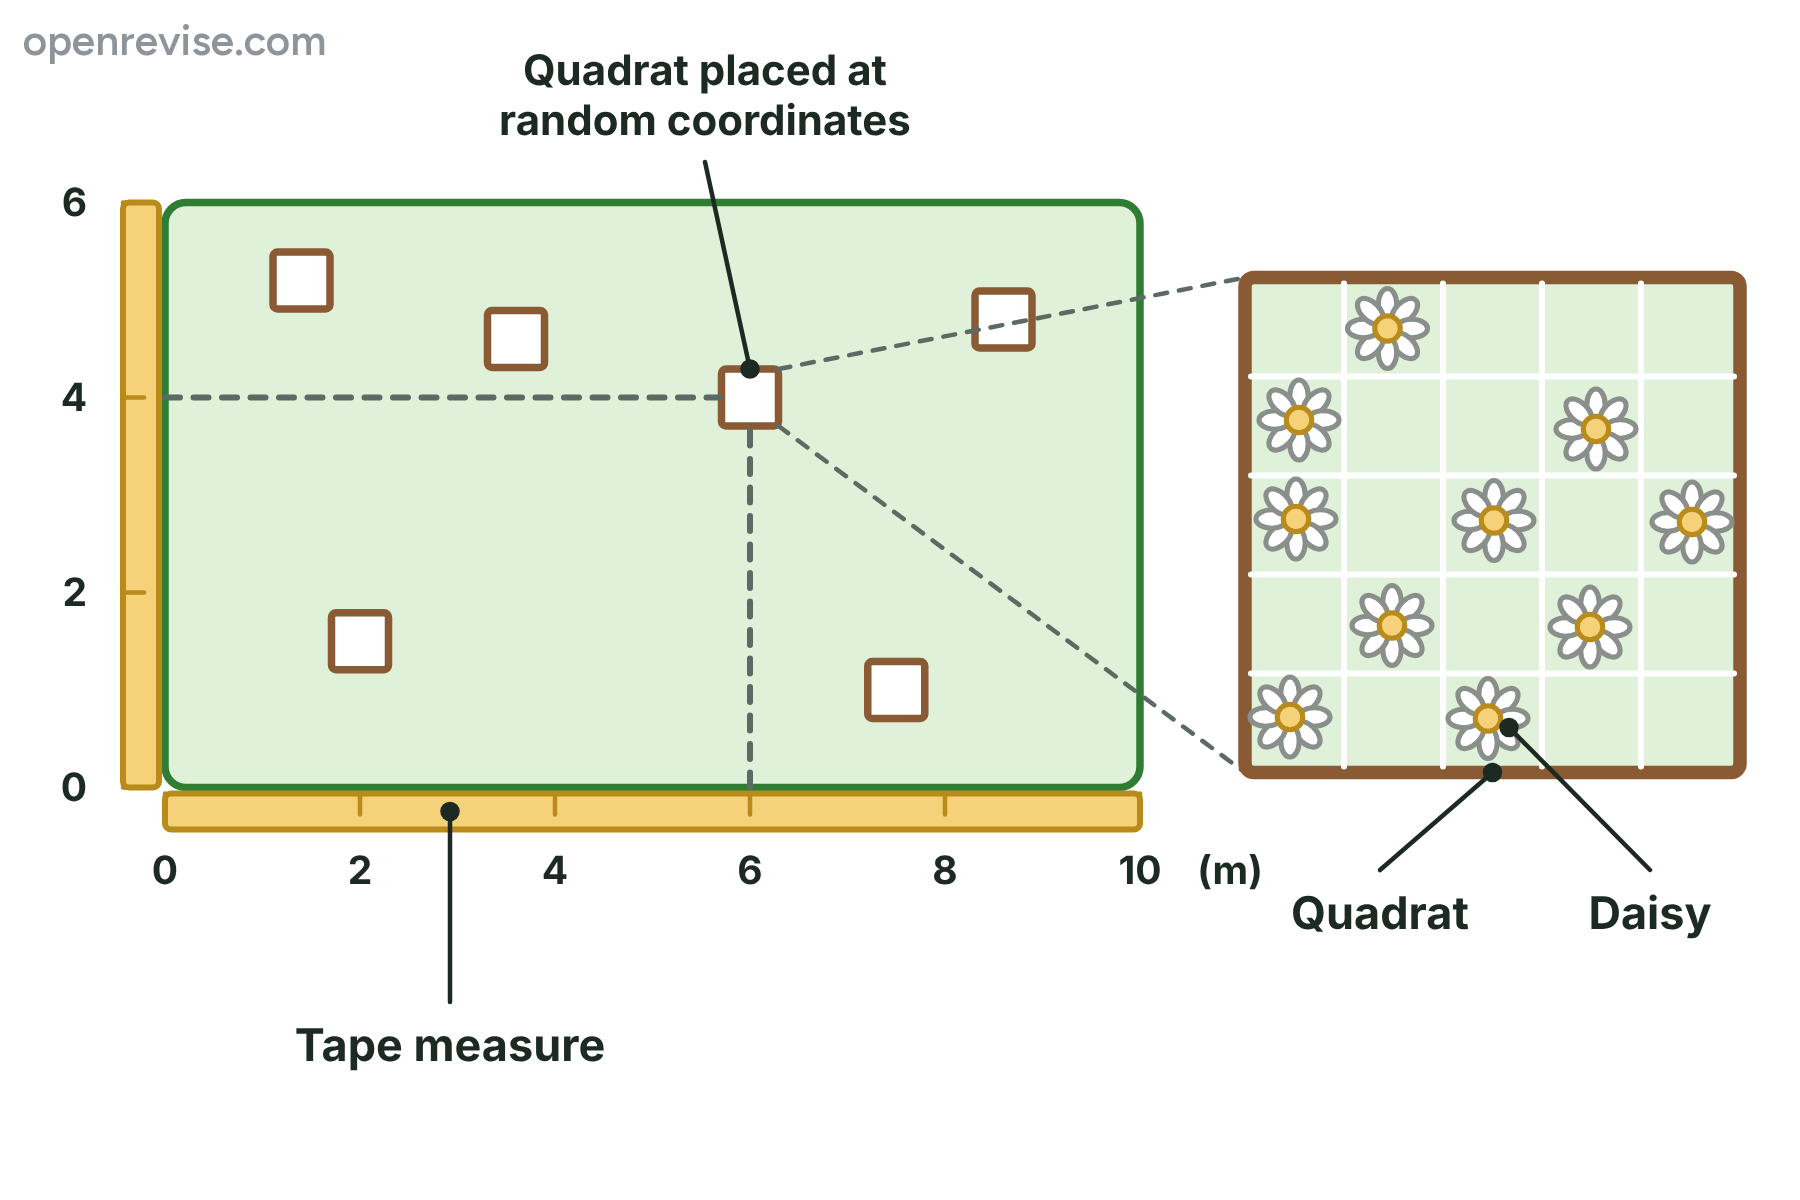
Lay tape measures along two sides to make a grid. Use random numbers as coordinates, place a quadrat at each, count the daisies in it and repeat at least 10 times. Then calculate the mean.
-
 What does this transect show about the distribution of the daisies?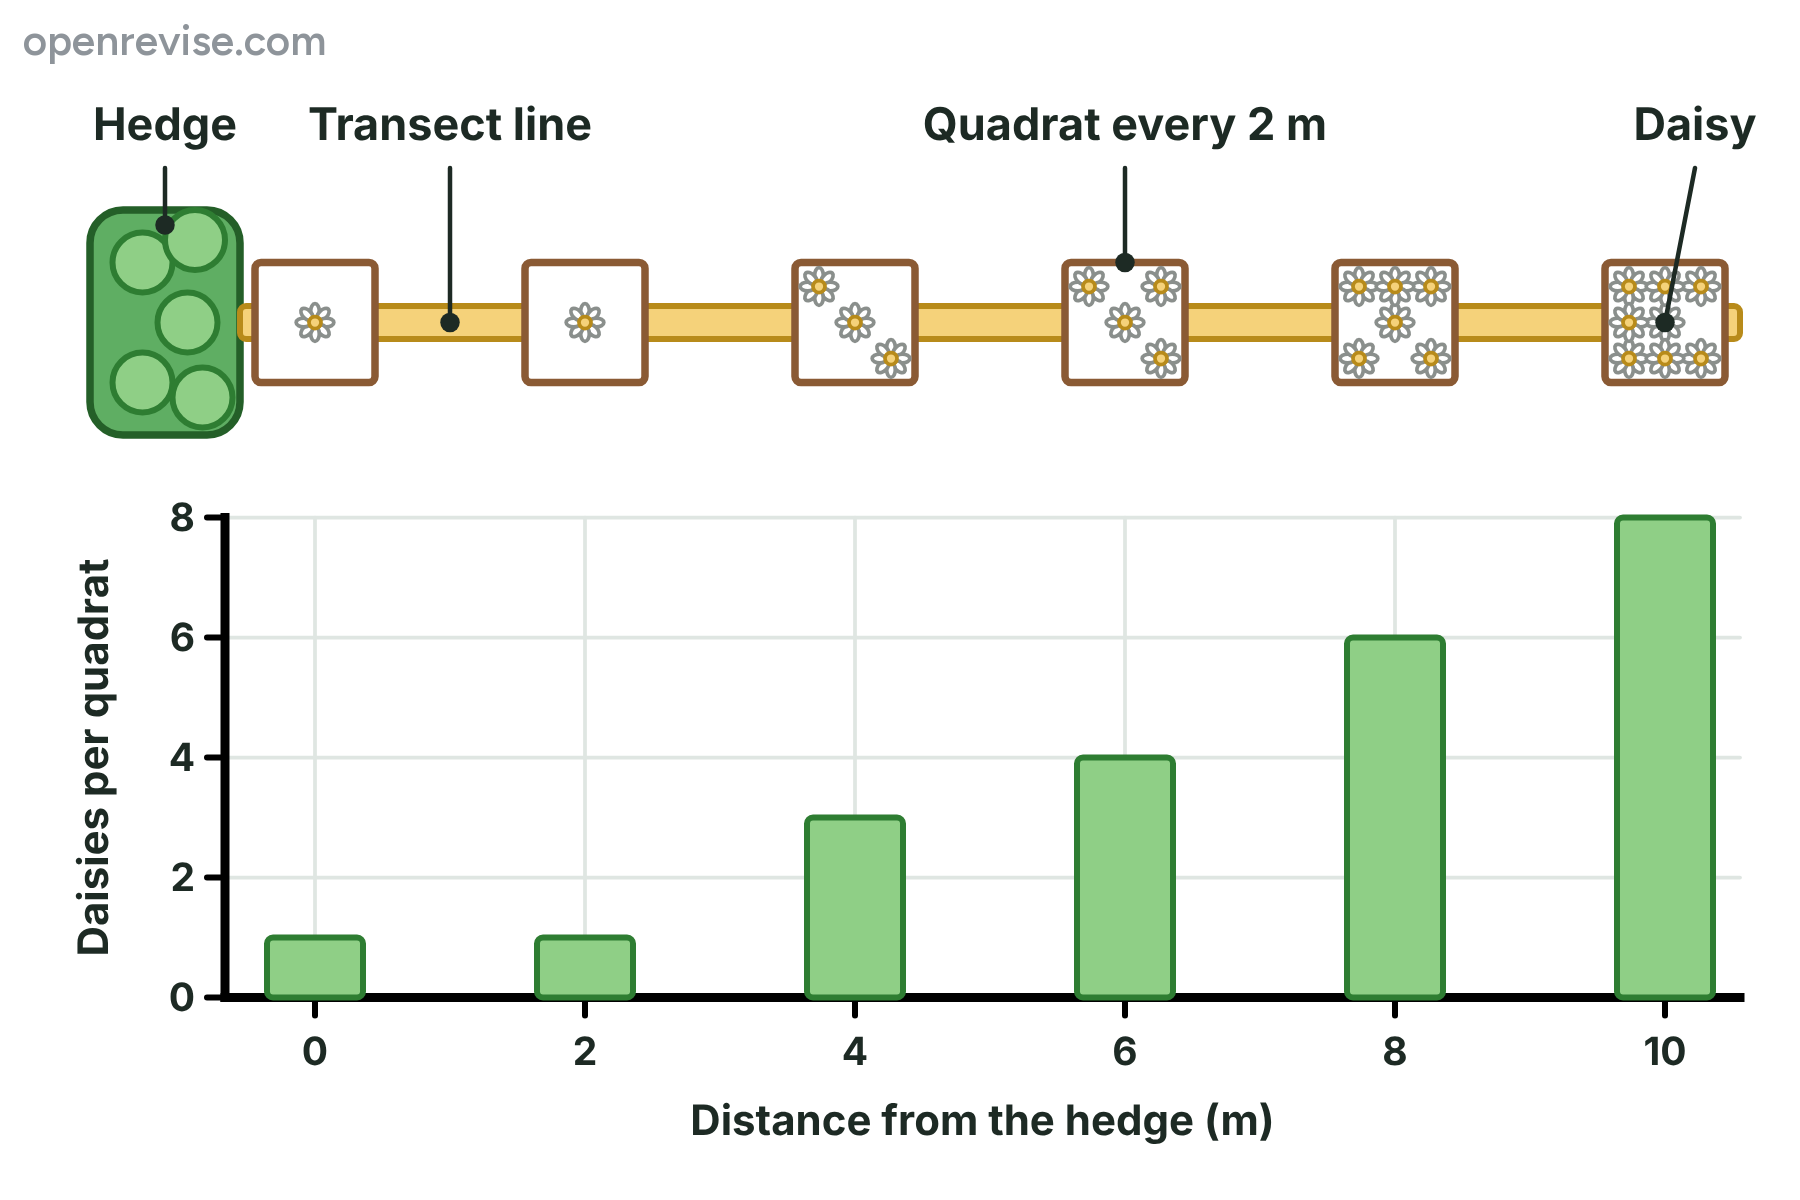
The number of daisies rises with distance from the hedge, from 1 per quadrat next to it to 8 at 10 m. This could be because there is more light and water away from the hedge.