Exam questions · Biology · Ecosystems and Communities
Fieldwork: Quadrats and Transects
- 8 exam questions
- 25 marks
- 8 quick checks
-
1 Name [1 mark]
Name the piece of equipment used to mark out a known area when sampling plants in a field.
Show answerHide answer
Model answer
A quadrat.
Mark scheme
- Quadrat — 1 mark
-
2 Explain [2 marks]
A student places each quadrat at a position chosen using random numbers. Explain why.
Show answerHide answer
Model answer
Using random numbers means that the student does not choose the places deliberately, so there is no bias. Every part of the area has the same chance of being sampled, so the sample is representative of the whole area.
Mark scheme
- To avoid bias (every position has an equal chance of being chosen) — 1 mark
- So that the sample is representative of the whole area — 1 mark
-
3 Describe [4 marks]
Describe how you would use quadrats to estimate the number of daisy plants on a school field.
Show answerHide answer
Model answer
Lay two tape measures at right angles along two sides of the field. Use random numbers to get coordinates, and place a quadrat at each pair of coordinates. Count the number of daisy plants inside each quadrat, using at least ten quadrats. Calculate the mean number of daisies per quadrat, then multiply it by the area of the field divided by the area of one quadrat.
Mark scheme
- Quadrats placed at random, using random number coordinates on two tapes — 1 mark
- Count the daisies in each quadrat — 1 mark
- Use many quadrats, and calculate the mean per quadrat — 1 mark
- Multiply the mean by (area of field divided by area of quadrat) — 1 mark
-
4 Calculate [3 marks]
A student counted dandelion plants in eight randomly placed quadrats, each 0.5 m by 0.5 m. The counts were 6, 4, 9, 5, 7, 3, 8 and 6. The field has an area of 250 m\(^2\). Estimate the number of dandelion plants in the field.
Show answerHide answer
Model answer
Total = 48, so the mean = \(48 \div 8 = 6\) per quadrat. Area of a quadrat = \(0.5 \times 0.5 = 0.25\ \text{m}^2\). Number of quadrats that fit in the field = \(250 \div 0.25 = 1000\). Estimated number = \(6 \times 1000 = 6000\) dandelions.
Mark scheme
- Mean = \(48 \div 8 = 6\) — 1 mark
- \(250 \div 0.25 = 1000\) — 1 mark
- \(6 \times 1000 = 6000\) — 1 mark
-
5 Calculate [2 marks]
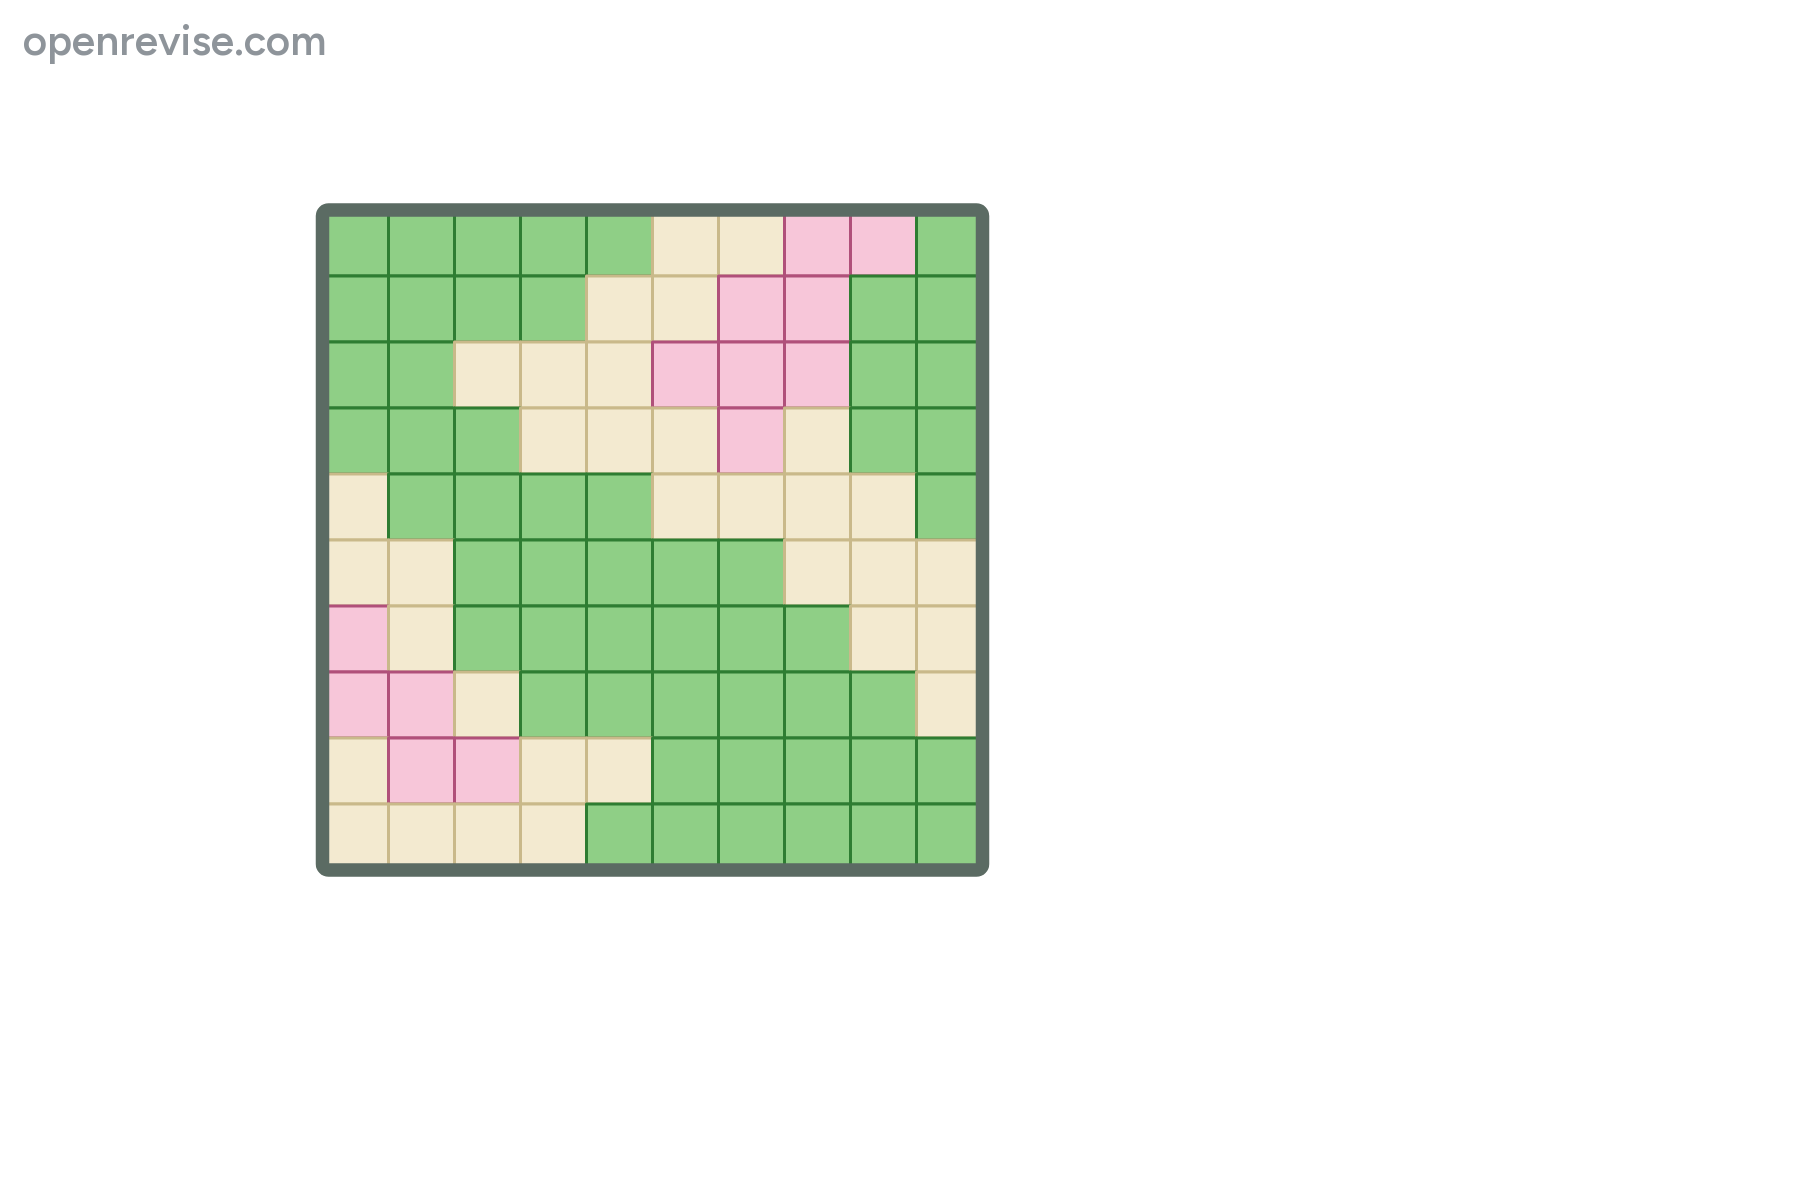
The diagram shows a quadrat with 100 squares. The pink squares are clover, the green squares are grass and the cream squares are bare soil. Calculate the percentage cover of clover, and the percentage of the quadrat that is bare soil.
Show answerHide answer
Model answer
There are 13 pink squares, so the clover covers 13%. There are 33 cream squares, so 33% of the quadrat is bare soil.
Mark scheme
- Clover = 13% — 1 mark
- Bare soil = 33% — 1 mark
-
6 Explain [3 marks]
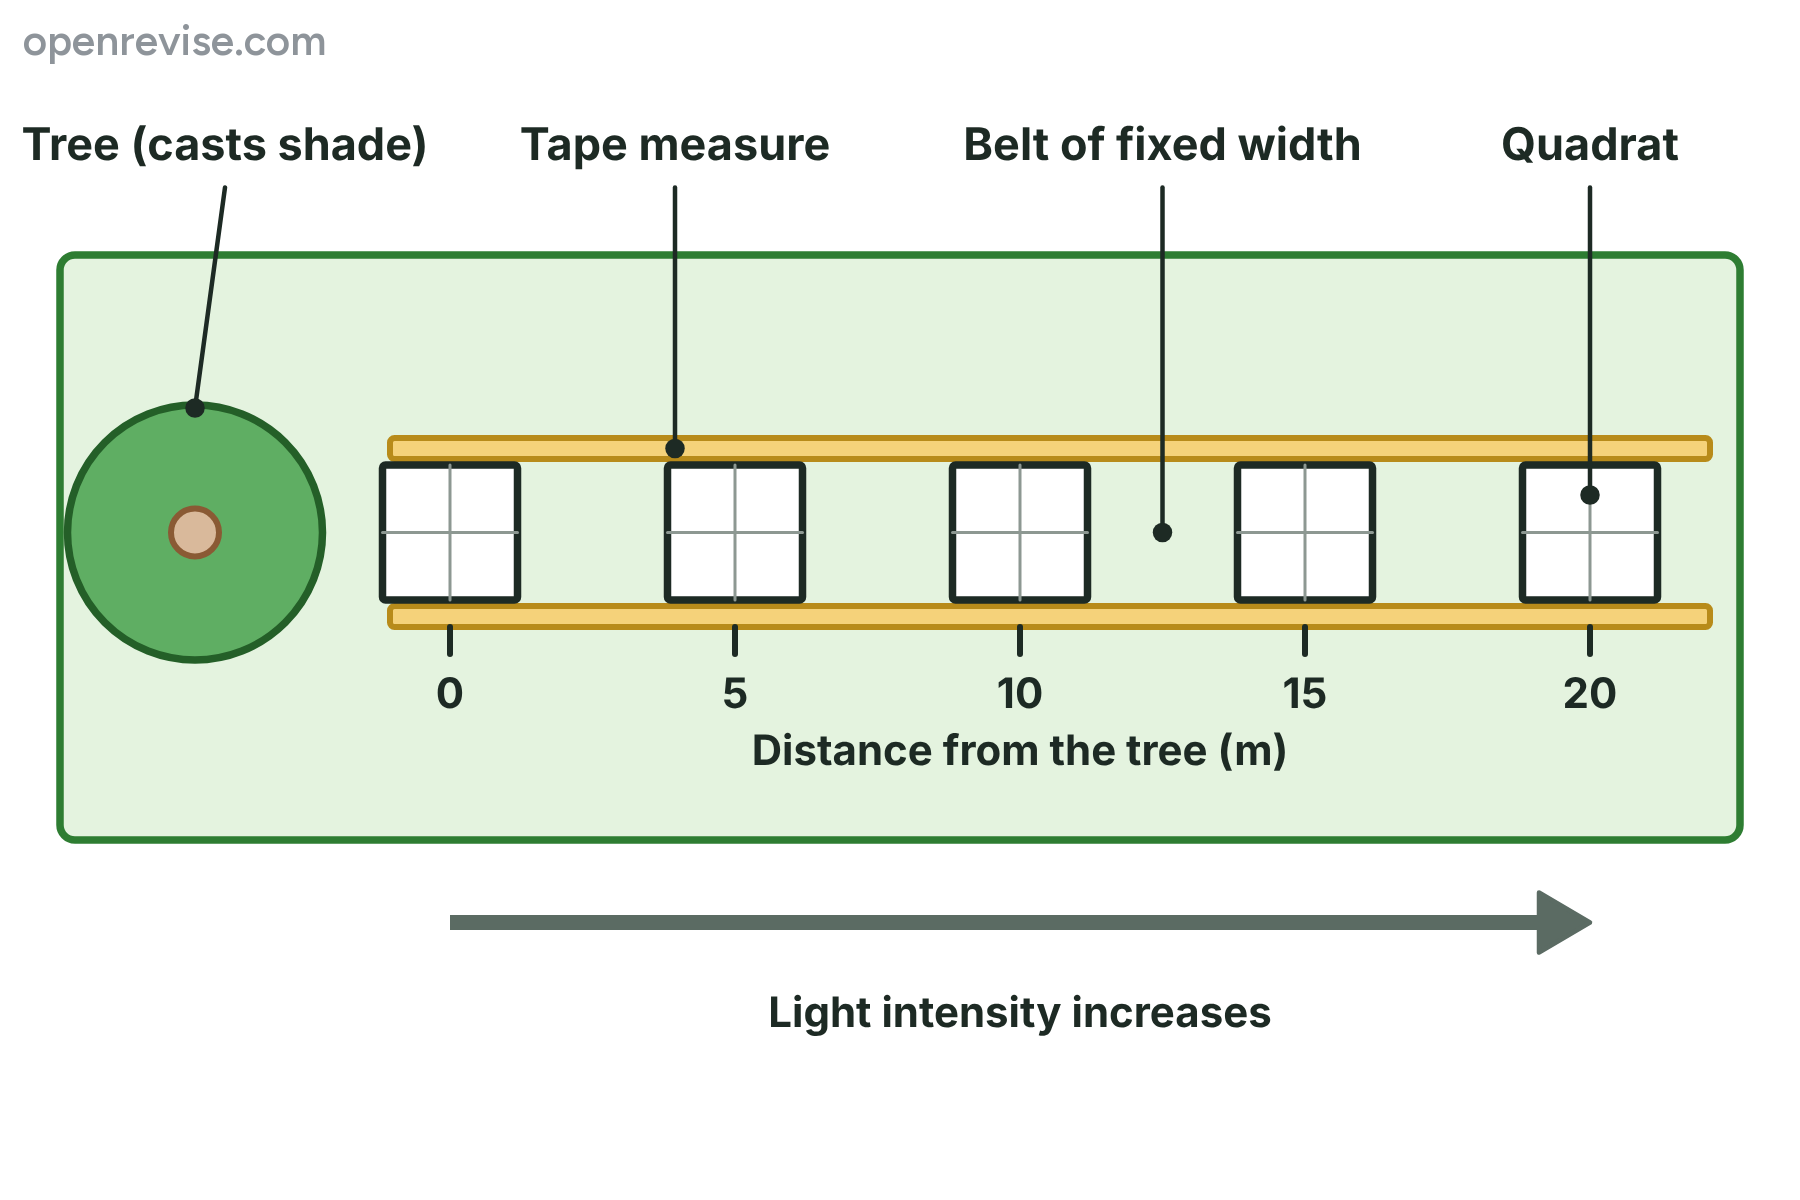
A student investigated how the plants in a field change with distance from a tree, as shown in the diagram. Explain why the student used a belt transect rather than quadrats placed at random.
Show answerHide answer
Model answer
The light intensity changes gradually from the shade of the tree to the open field. A belt transect samples the quadrats in order along this gradient at regular intervals, so the student can see how the plants change as the light intensity changes. Random quadrats would not show how the pattern changes along the line.
Mark scheme
- The environment changes steadily (a gradient) with distance from the tree — 1 mark
- Quadrats at regular intervals along a line sample the whole gradient in order — 1 mark
- This shows how the distribution of plants changes with the abiotic factor — 1 mark
-
7 Describe [4 marks]
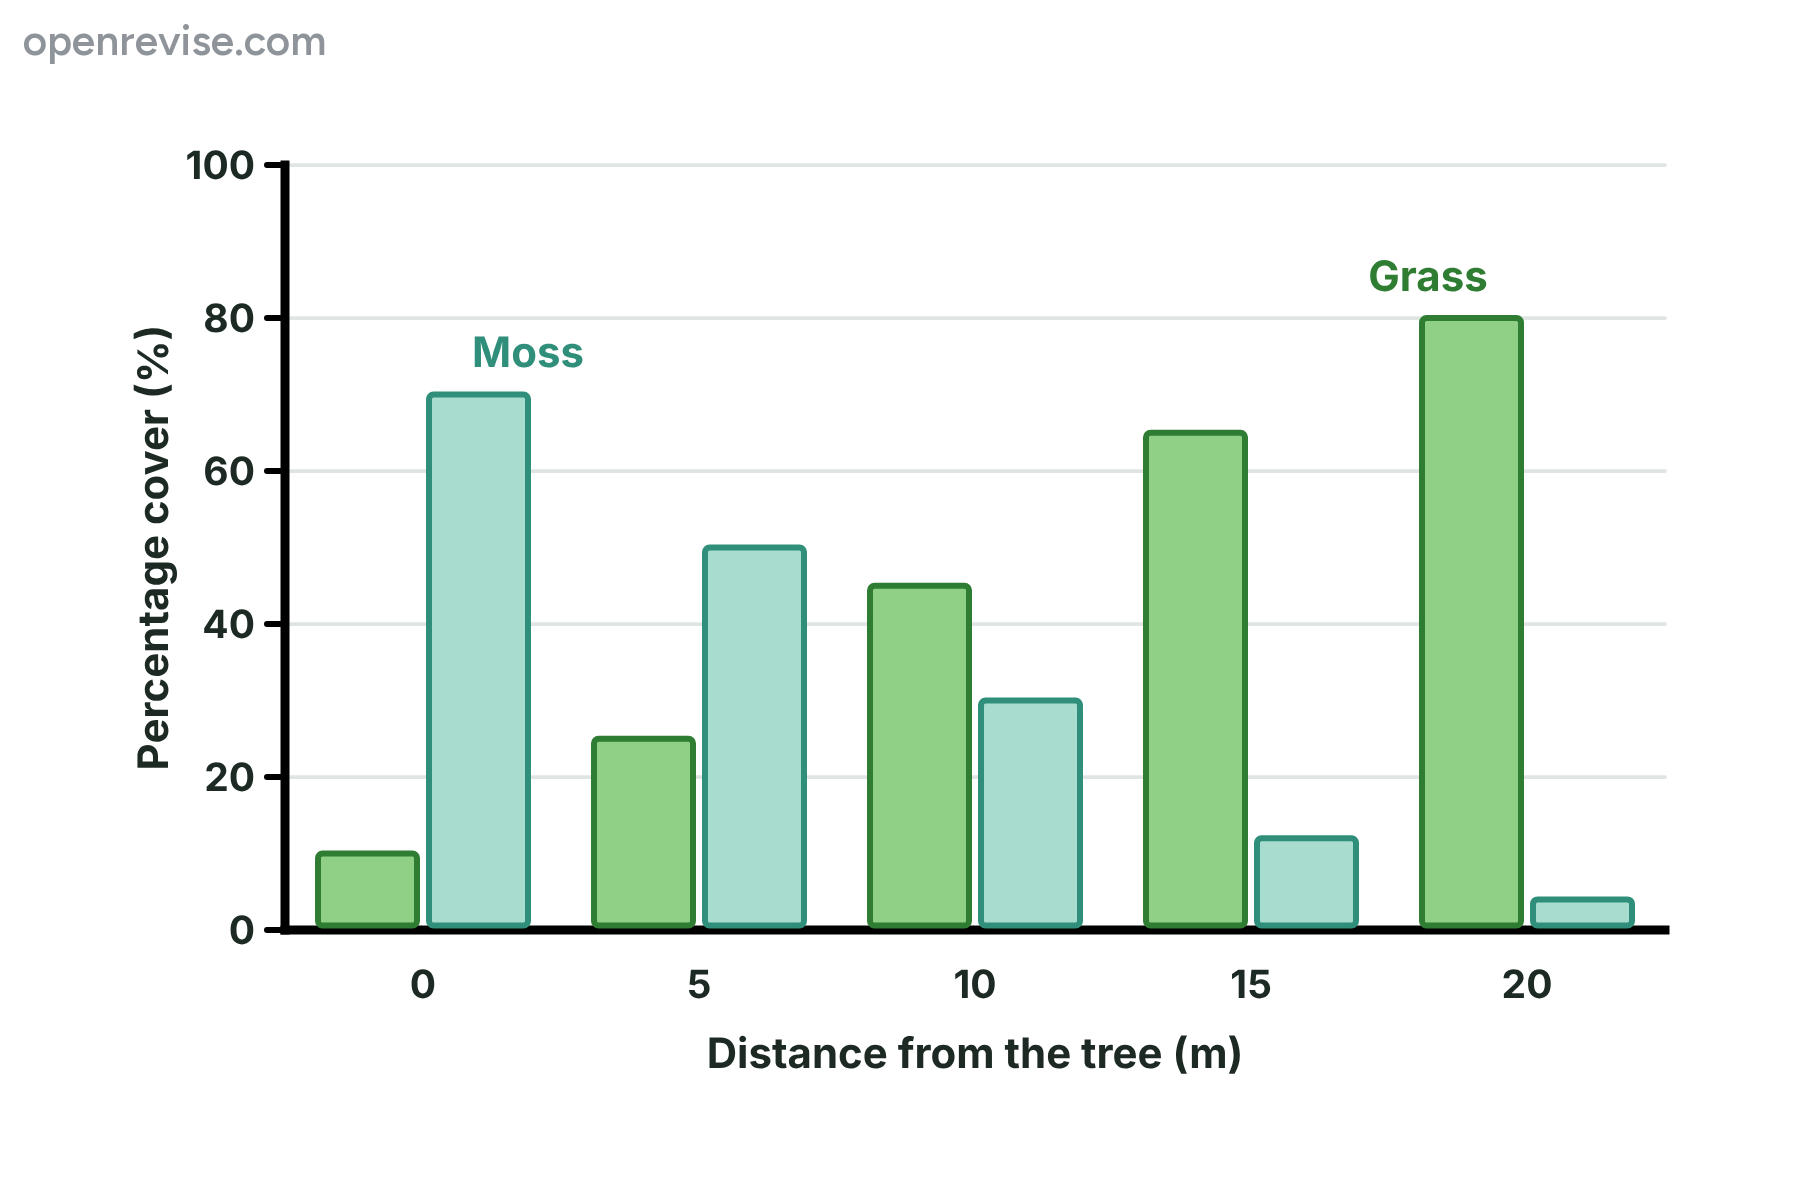
The bar chart shows the percentage cover of grass and moss along a transect from the base of a tree. Describe the results, and suggest an explanation for the distribution of the moss.
Show answerHide answer
Model answer
As the distance from the tree increases, the percentage cover of grass increases from 10% to 80%, while the cover of moss decreases from 70% to 4%. Moss is most common close to the tree. A possible explanation is that the tree casts shade and the soil near it is damper, and moss is better adapted to low light and damp conditions than the grass.
Mark scheme
- Grass cover increases with distance (10% to 80%) — 1 mark
- Moss cover decreases with distance (70% to 4%) — 1 mark
- Suggestion that there is less light (shade) or more moisture near the tree — 1 mark
- Moss is better adapted to shade or damp conditions than grass — 1 mark
-
8 Evaluate [6 marks]
A student wanted to compare the number of buttercup plants on two fields. In each field she placed three quadrats where there seemed to be buttercups, counted the plants, and compared the totals. Evaluate her method and suggest how she could improve it.
Show answerHide answer
Model answer
Placing the quadrats where there seemed to be buttercups introduces bias, because the places are not representative of the whole field and will overestimate the number of buttercups. The sample of three quadrats is also too small, so the results are not reliable and chance could affect them. She should place the quadrats using random coordinates, so that every part of the field has an equal chance, and use many more quadrats, at least ten in each field, and then calculate the mean per quadrat. She should use the same size of quadrat, count at the same time of year and day, and compare the mean number of buttercups per square metre, or scale up to the area of the field, so that fields of different sizes can be compared fairly. She should also use a key so that buttercups are not confused with other yellow flowers.
Mark scheme
- Placing quadrats deliberately where buttercups are seen is biased — 1 mark
- Random coordinates (random numbers) should be used instead — 1 mark
- Three quadrats is a small sample, so the results are unreliable — 1 mark
- Use many more quadrats and calculate a mean — 1 mark
- Control variables, such as the same quadrat size, time and counting method — 1 mark
- Compare means per square metre, or the estimated total for each field, and use an identification key — 1 mark
Quick check
-
1
What is the main reason for placing quadrats at random?
Show answerHide answer
C: It avoids bias in the sample
Random placement means every part of the area has the same chance of being sampled, which removes bias.
-
2
A belt transect is most useful for investigating which of these?
Show answerHide answer
A: How organisms change from shade to open ground
A transect samples along a line, so it shows how organisms change across a gradient, such as from shade into light.
-
3
The counts of a plant in five quadrats are 2, 6, 4, 5 and 3. What is the mean?
Show answerHide answer
D: 4
The total is 20, and 20 divided by 5 is 4.
-
4
How many 0.5 m by 0.5 m quadrats would fit into an area of 50 m\(^2\)?
Show answerHide answer
B: 200
A quadrat has an area of 0.25 m\(^2\), and 50 divided by 0.25 is 200.
-
5
A mean of 3 plants per quadrat was found using 1 m by 1 m quadrats in a field of 1200 m\(^2\). How many plants are estimated to be in the field?
Show answerHide answer
C: 3600
One quadrat is 1 m\(^2\), so 1200 quadrats fit in the field, and 3 times 1200 is 3600.
-
6
On a quadrat with 100 squares, 27 squares are covered by clover. What is the percentage cover of clover?
Show answerHide answer
A: 27%
Each square is 1%, so 27 squares are 27% cover.
-
7
Which of these would make quadrat results more reliable?
Show answerHide answer
D: Using more quadrats placed at random
A larger sample, with the quadrats placed at random, is more representative, so the results are more reliable.
-
8
A scatter graph of plant cover against light intensity shows a rising line of best fit. What does this show?
Show answerHide answer
B: A positive correlation between light and plant cover
The crosses rising from lower left to upper right show a positive correlation, which is a link but not proof of cause.