Biology · Ecosystems and Communities
Fieldwork: Quadrats and Transects
You cannot count every daisy in a field, so ecologists count a sample and scale it up. This lesson is for both Combined Science and separate Biology. It covers the core practical on investigating how organisms are related to their environment with quadrats and belt transects, and how to calculate numbers in a whole area, means and percentage cover from your raw data.
Learning Objectives
- 1Describe a method for investigating the relationship between organisms and their environment, using random quadrats and belt transects.
- 2Explain why sampling is random, and how to place quadrats without bias.
- 3Calculate the mean number of organisms per quadrat, the number of organisms in a whole area, and percentage cover, from raw data.
- 4Evaluate fieldwork data, including sources of error and how to make the results more reliable.
Retrieval practice
-
1
What is an abiotic factor?
Show answerHide answer
A non-living factor in the environment, such as light intensity, temperature or soil moisture.
-
2
How do you calculate a mean?
Show answerHide answer
Add up all the values, then divide by the number of values.
-
3
What is the area of a square quadrat with sides of 0.5 m?
Show answerHide answer
\(0.5 \times 0.5 = 0.25\ \text{m}^2\).
-
4
What is a population?
Show answerHide answer
All the organisms of one species living in the same place at the same time.
Why we sample
Counting every dandelion on a school field would take days and would trample the very plants you were studying. Ecologists solve this by sampling: they count the organisms in a few small areas and use the results to describe the whole habitat. The sample has to be fair and large enough, or the results will not be a good estimate. The specification asks for two techniques, quadrats placed at random and belt transects placed along a line.
Sampling with quadrats
A quadrat is a square frame that marks out a small known area of ground, often 0.5 m by 0.5 m (0.25 square metres) or 1 m by 1 m.
-
What you record
In each quadrat you identify the species and either count the number of individual plants or animals, or estimate how much of the quadrat is covered by each species (the percentage cover).
-
Why random sampling
If you put the quadrat where the plants look interesting, you will get biased results that do not represent the whole area. Random sampling gives every part of the area the same chance of being chosen.
-
Placing quadrats at random
Lay two long tape measures at right angles along two sides of the study area. Use a random number generator or random number table to get a pair of coordinates, and place the quadrat at that point. Repeat for every quadrat.
-
A big enough sample
The more quadrats you use, the more representative the sample is and the more reliable the results. At least ten quadrats is a common minimum, and more is better.
Random sampling with quadrats
The method works best when the area is fairly uniform and you want to estimate how many organisms there are altogether, or compare two habitats.
Placing quadrats at random
- Lay out the tapes Put one tape along each of two sides of the area at right angles.
- Get coordinates Use random numbers for the distance along each tape, for example 34 m and 12 m.
- Place the quadrat Put the quadrat on the ground where the two coordinates meet, and record what is inside it.
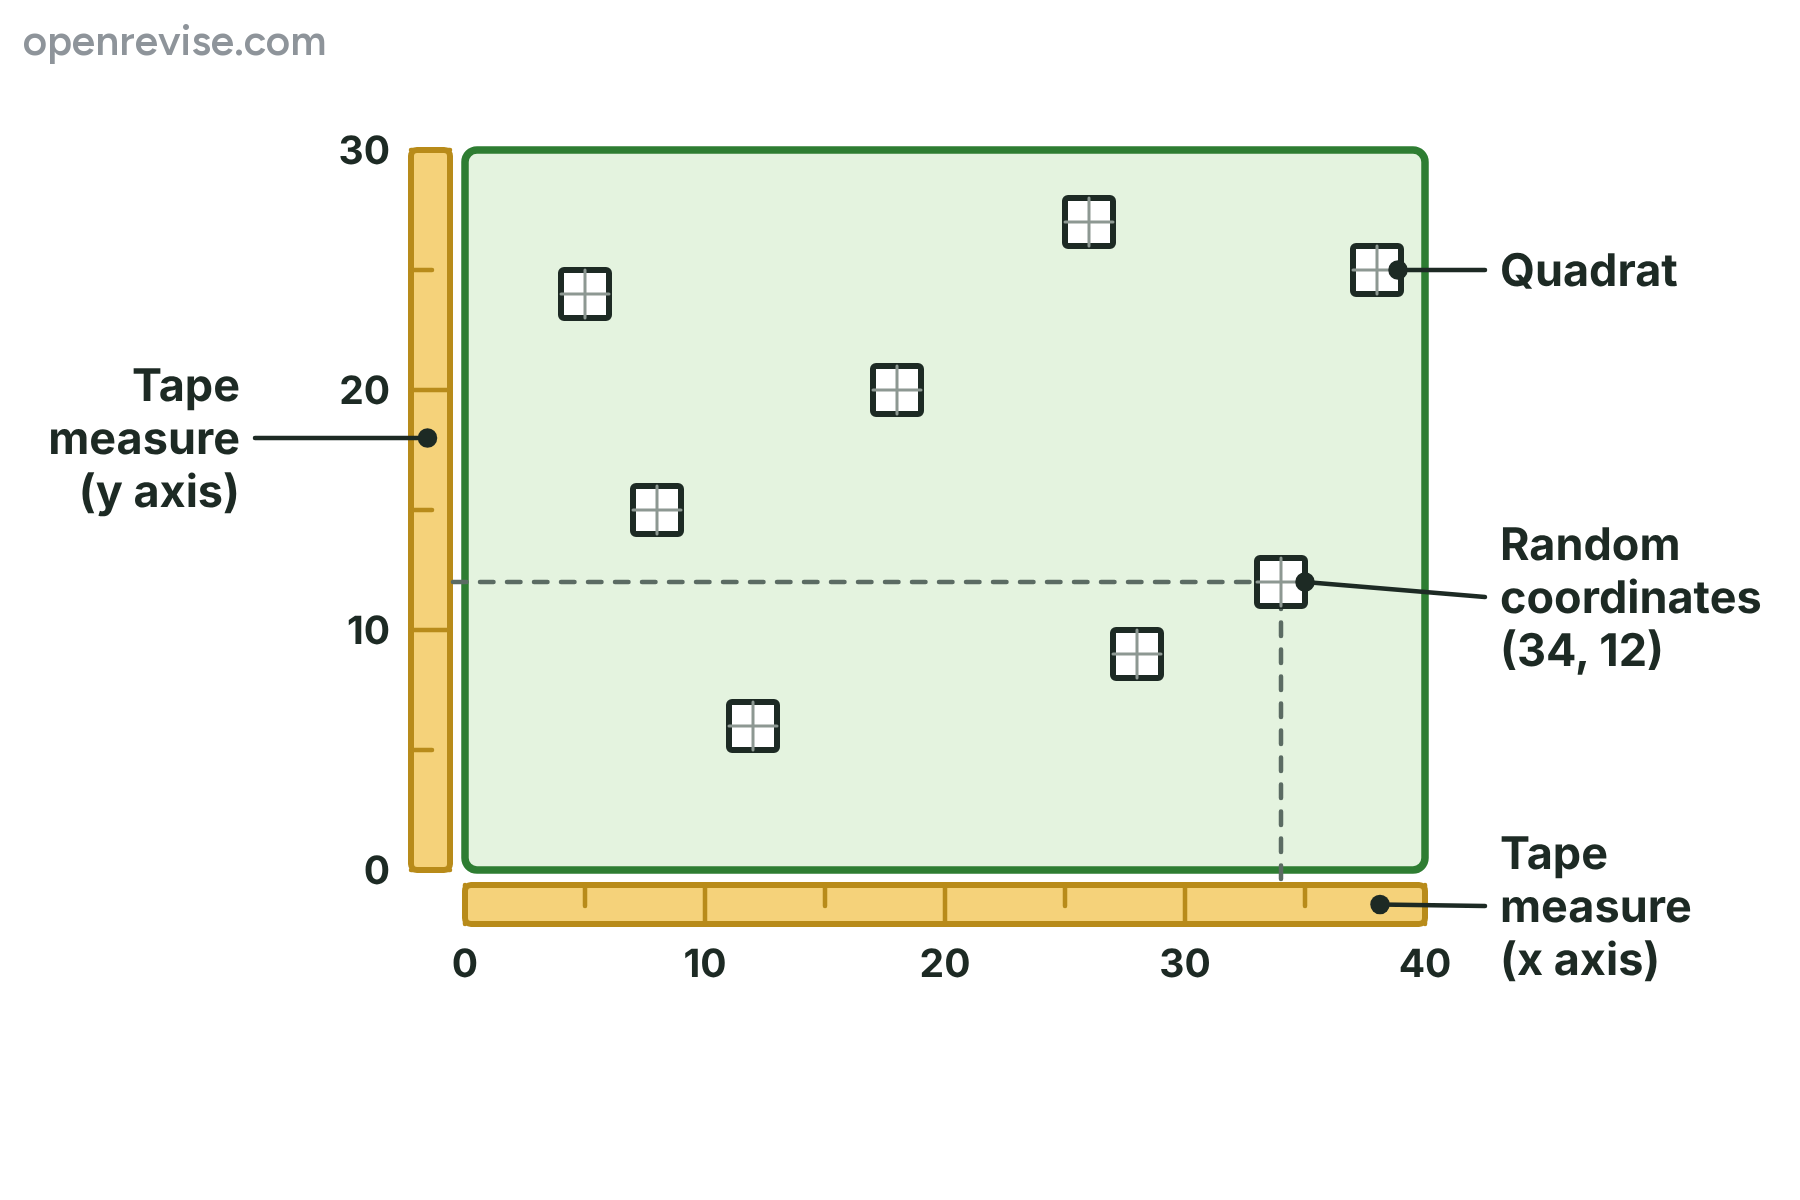
Random coordinates from a calculator or table decide where each quadrat goes.
Belt transects
Random sampling is not the best choice when conditions change steadily across a habitat, for example from the shade of a tree out into an open field. For that you use a belt transect.
-
What a belt transect is
A tape measure is laid in a straight line across the habitat, and a belt of fixed width on either side of the line is sampled. Quadrats are placed at regular intervals along the line, for example every 5 m.
-
Why it is used
It samples the whole gradient in order, from one end to the other, so you can see how the distribution of the organisms changes as the environment changes. Random quadrats would miss this pattern.
-
Measuring the environment
At every quadrat you measure the abiotic factors that might explain the pattern, such as light intensity with a light meter, soil moisture with a moisture meter, temperature and soil pH.
-
Interpreting the results
You plot the abundance or percentage cover of each species against the distance, and look for a link with the abiotic factor. A scatter graph with a line of best fit shows whether there is a correlation.
A belt transect from a tree into open ground
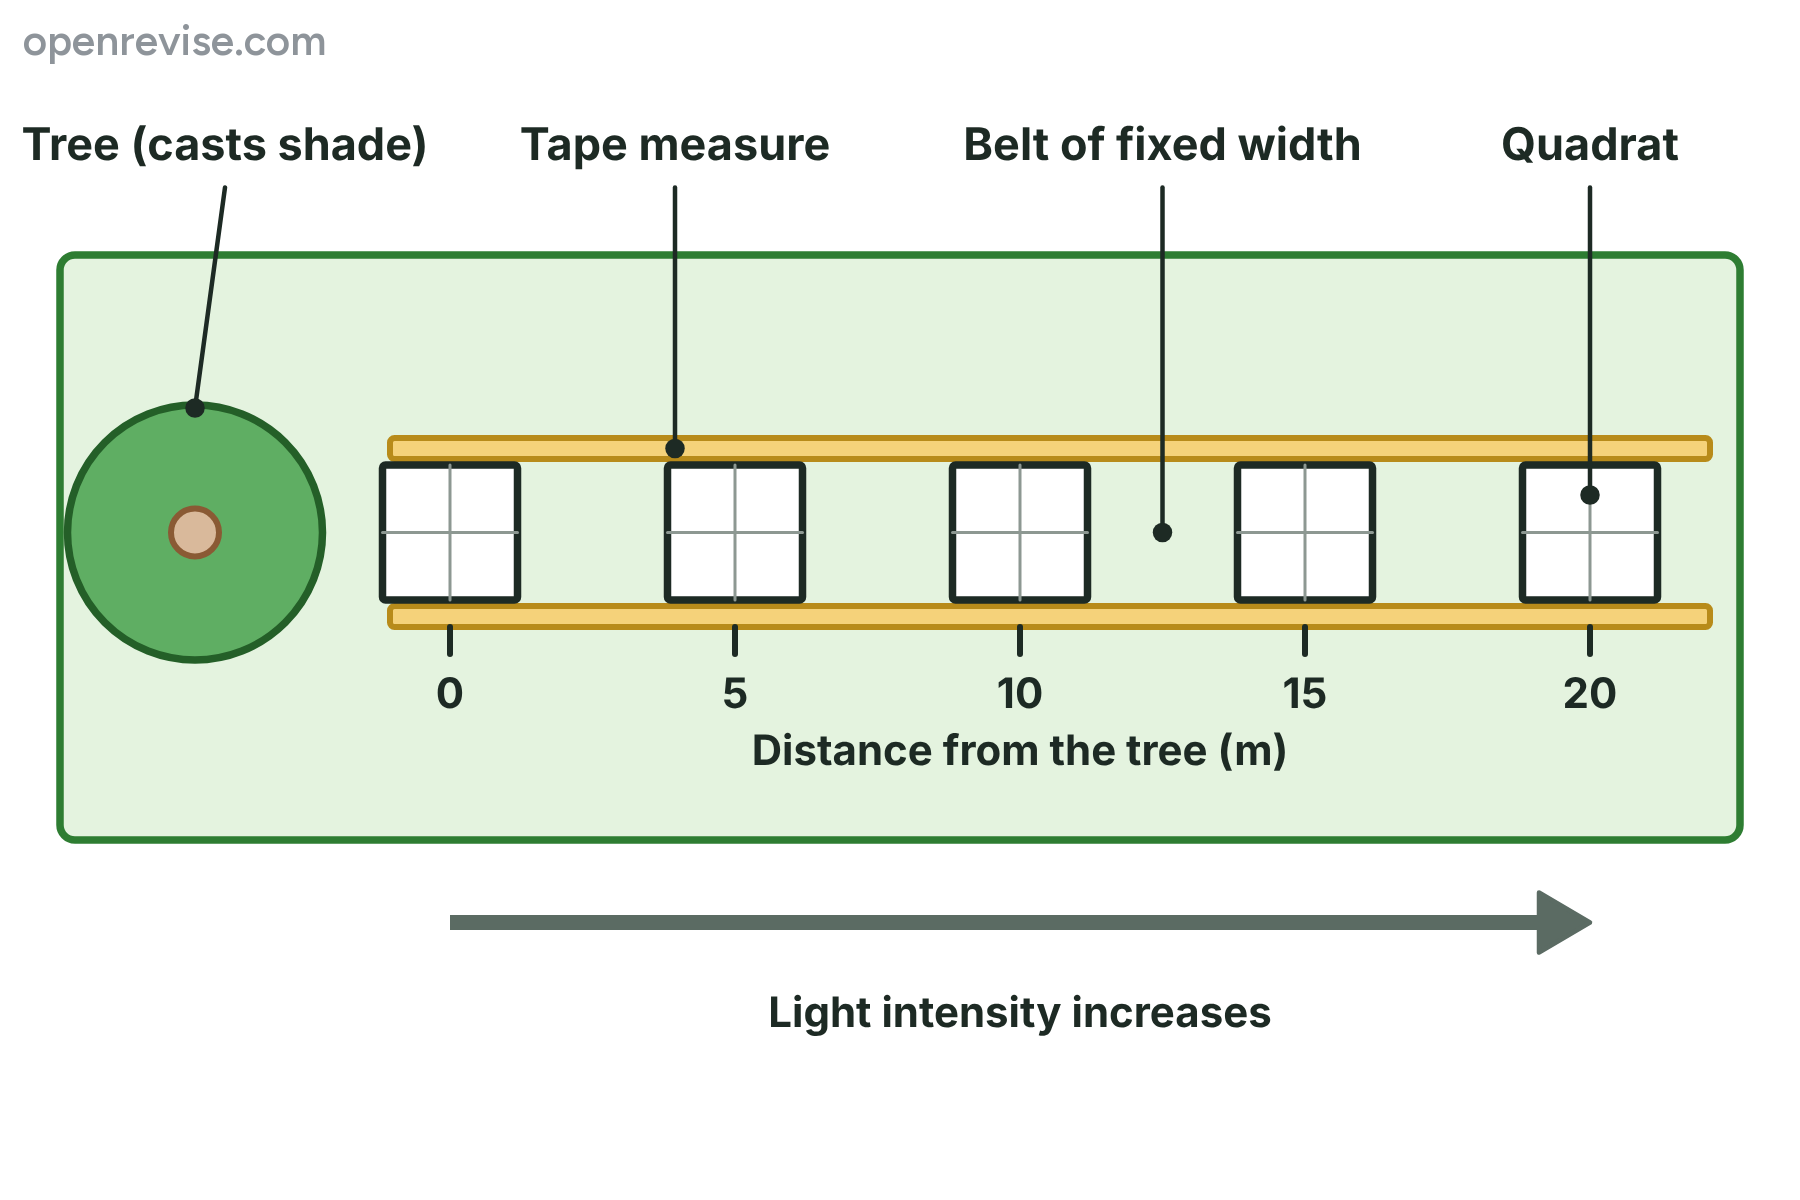
Quadrats at regular intervals along a line show how the community changes along a gradient.
Random sampling or a belt transect?
Random sampling with quadrats
- Quadrat positions chosen with random numbers
- Avoids bias in where the quadrats are placed
- Used to estimate the total number of organisms in an area
- Best where the habitat is fairly uniform
Belt transect
- Quadrats at regular intervals along a line
- Shows how the organisms change along a gradient
- Used to link distribution to an abiotic factor
- Best where conditions change, such as from shade to light
Core practical: a belt transect investigation
A typical method for investigating how the distribution of a plant is related to an abiotic factor, such as light intensity, from the base of a tree out into an open field.
-
1
Choose the gradient
Pick a straight line that runs from the shade under a tree out into an open area.
-
2
Lay the tape
Lay a 20 m tape measure in a straight line from the base of the tree, with a second tape alongside to mark the belt.
-
3
Place the quadrats
Place a 0.5 m by 0.5 m quadrat at 0 m and then at every 5 m along the line.
-
4
Record the organisms
In each quadrat identify the species with a key and count the individuals or estimate the percentage cover.
-
5
Record the abiotic factor
At each quadrat measure light intensity with a light meter held at the same height and in the same direction.
-
6
Repeat and process
Repeat on a second transect, calculate the mean at each distance, and plot a graph of abundance against distance.
Controlling variables and keeping safe
The test is only fair if the only thing that changes is the distance from the tree.
-
Keep these the same
Use the same quadrat size each time, record at the same time of day, use the same method of counting or estimating, and ideally use the same person for estimating cover.
-
Light readings
Take the light readings at the same time, because the light changes through the day and with cloud.
-
Safety
Cover your legs and wear gloves to avoid ticks and stinging plants, wash your hands afterwards, and never touch an unknown plant or fungus. Stay away from water and roads.
-
Care for the habitat
Avoid trampling the area you are about to sample, and leave the habitat as you found it.
Percentage cover in a quadrat
Plants such as grass grow so close together that you cannot count single plants, so you estimate the percentage of the quadrat that each species covers.
Estimating percentage cover
- Count squares Count the squares that a species covers. On a 10 by 10 grid, each square is 1% of the area.
- Part squares Count a square if the species covers more than half of it.
- Use a mean Take the mean of the percentage cover from all the quadrats.
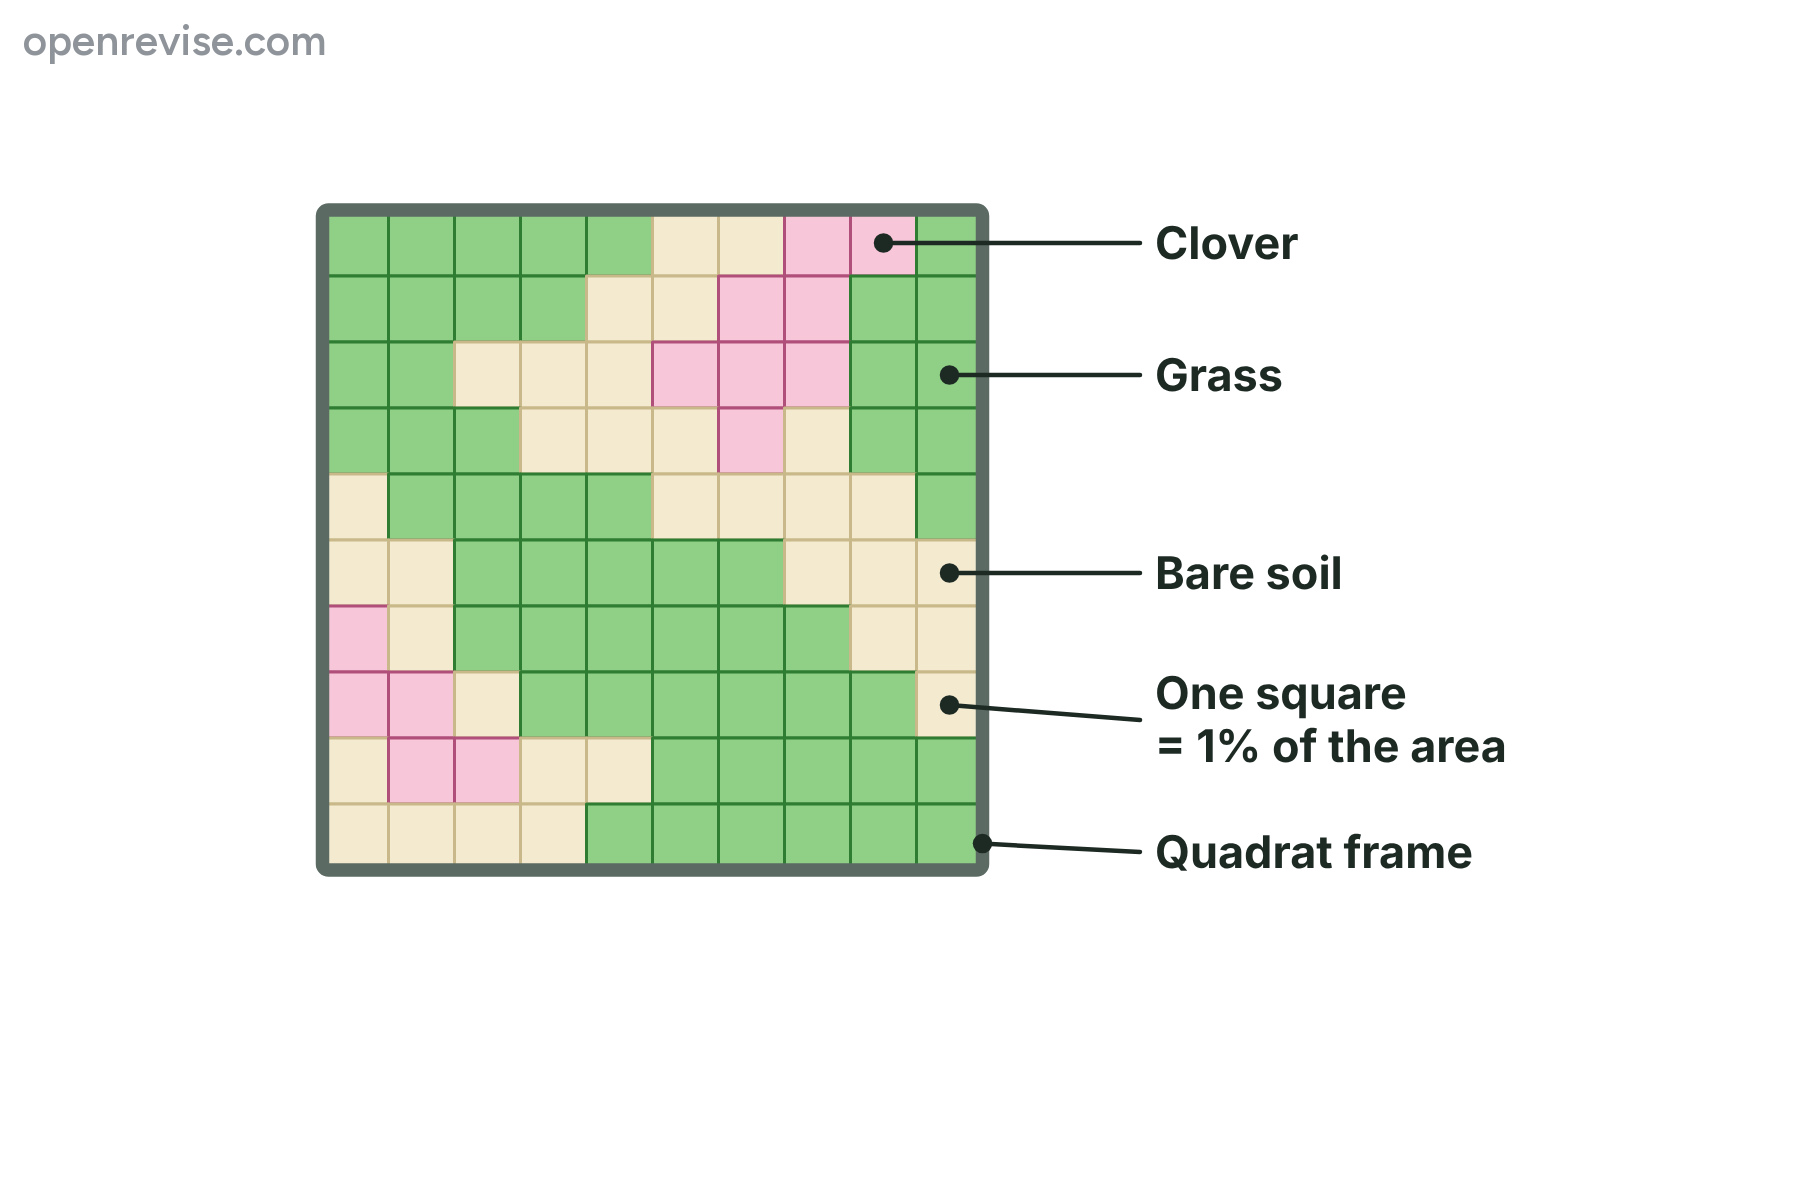
With 100 squares, each square is 1% of the area.
Calculating from quadrat data
The specification asks you to use raw data to work out how many organisms there are in a given area. These three calculations are the ones to learn.
-
Mean number per quadrat
Add up the numbers counted in all the quadrats, then divide by the number of quadrats.
-
Number in the whole area
Divide the area of the whole habitat by the area of one quadrat to find how many quadrats would fit in it, then multiply by the mean number per quadrat. This gives an estimate, because it is based on a sample.
-
Percentage cover
Divide the number of squares covered by the total number of squares, then multiply by 100. Take the mean of the percentage cover in all quadrats.
-
Number per square metre
Divide the mean number per quadrat by the area of the quadrat in square metres, so a mean of 4 plants in a 0.25 m\(^2\) quadrat is 16 plants per m\(^2\).
Estimating the number of daisies in a field
Students counted daisy plants in ten randomly placed quadrats, each 0.5 m by 0.5 m. The counts were 3, 5, 2, 6, 4, 3, 7, 5, 4 and 1. The field has an area of 600 m\(^2\). Estimate the number of daisy plants in the field.
Show the solutionHide the solution
- 1 Add up the counts \(3 + 5 + 2 + 6 + 4 + 3 + 7 + 5 + 4 + 1 = 40\)
- 2 Calculate the mean per quadrat \(40 \div 10 = 4.0\) daisies per quadrat
- 3 Find the area of one quadrat \(0.5 \times 0.5 = 0.25\ \text{m}^2\)
- 4 Find how many quadrats fit in the field \(600 \div 0.25 = 2400\)
- 5 Multiply \(4.0 \times 2400 = 9600\) daisy plants
AnswerAbout 9600 daisy plants.
Mean percentage cover
The percentage cover of grass in five quadrats was 54, 41, 60, 47 and 48. Calculate the mean percentage cover of grass.
Show the solutionHide the solution
- 1 Add the values \(54 + 41 + 60 + 47 + 48 = 250\)
- 2 Divide by the number of quadrats \(250 \div 5 = 50\)
- 3 State the unit 50% cover
Answer50%
Reading the results of a transect
A graph like this lets you describe a pattern, and then link it to the abiotic factor you measured.
What the data show
- Grass The cover of grass rises steadily from 10% at the tree to 80% at 20 m, where it is brightest.
- Moss The cover of moss falls from 70% at the tree to 4% at 20 m, so it is found mostly in the shade.
- A link, not proof The pattern fits the change in light intensity, but other factors, such as soil moisture or the roots of the tree, may also change with distance.
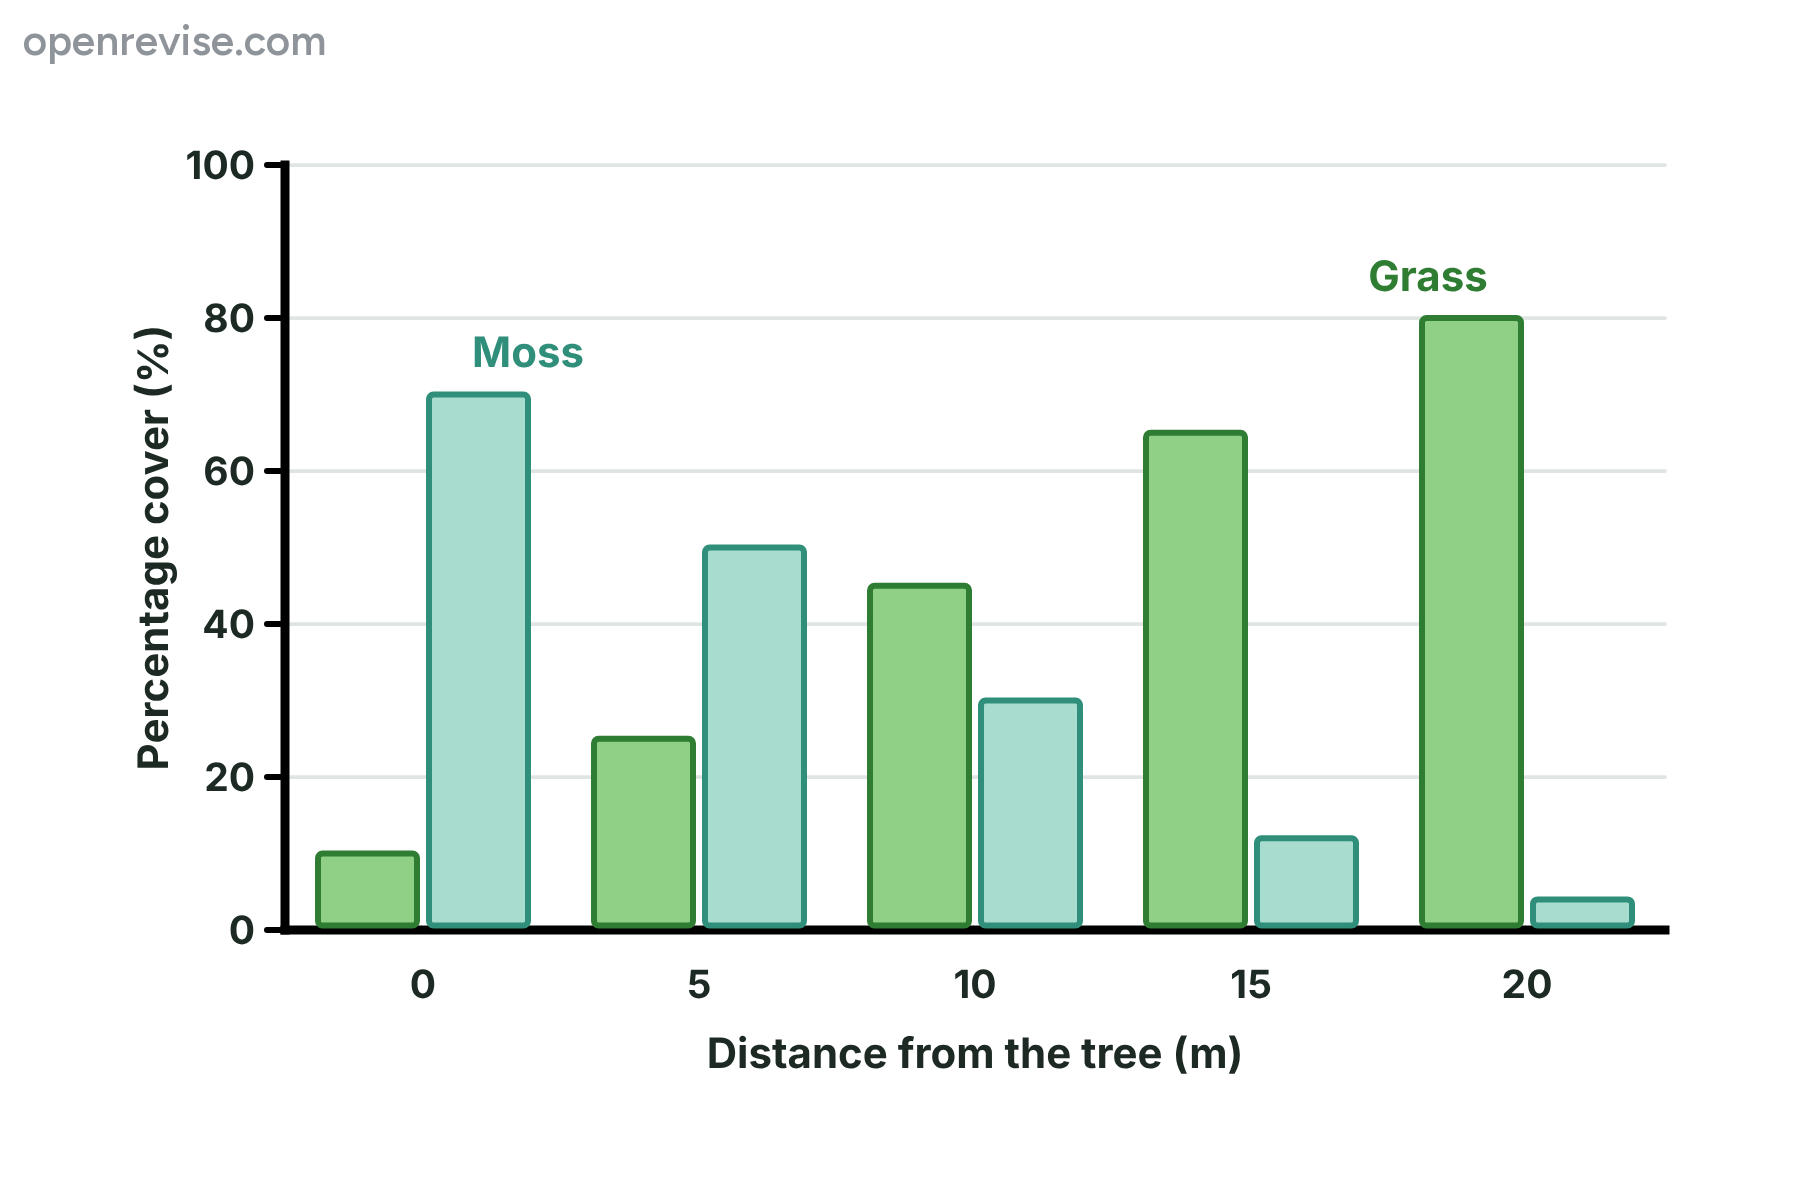
Grass is more common in the light, and moss is more common in the shade.
Looking for a correlation
A scatter graph shows whether two variables are related. If the crosses go uphill, there is a positive correlation, if they go downhill there is a negative correlation, and if they are scattered there is none. A correlation shows a link, but it does not prove that one variable causes the other.
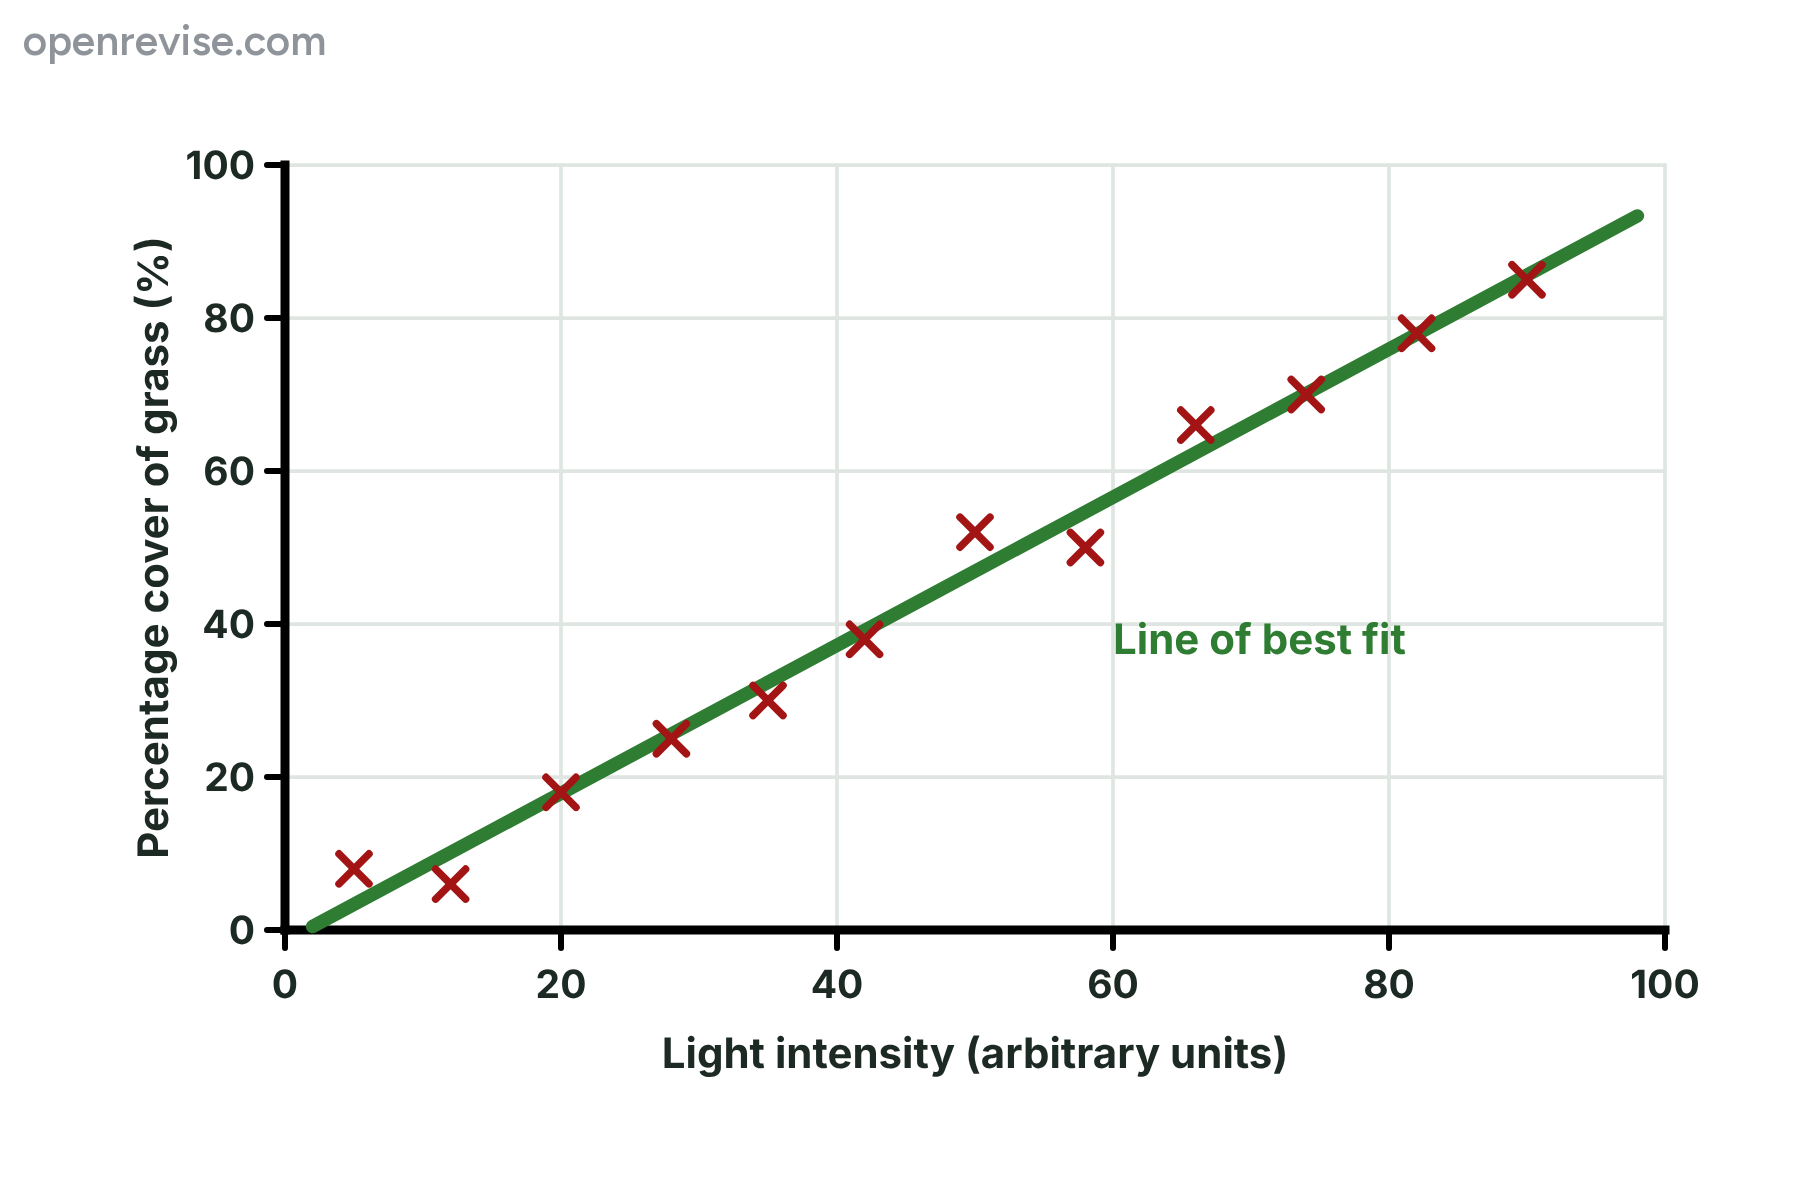
A positive correlation: as light intensity rises, so does the percentage cover of grass.
Evaluating the fieldwork
Fieldwork results are never perfect. Name the weakness, say what effect it has, and say how to fix it.
-
Too few quadrats
A small sample may not be representative, so the results are less reliable. Use more quadrats, repeat the transect and calculate means.
-
Bias in placing quadrats
Choosing spots by eye gives a biased sample. Use random numbers for coordinates, and never throw the quadrat.
-
Identification and counting errors
Species may be mistaken for each other and plants with overlapping stems are hard to count. Use an identification key, decide in advance what counts as one plant, and use the same recorder.
-
Uncontrolled variables
Time of day, weather, season, trampling and other abiotic factors such as soil moisture can all change the results. Record at the same time and measure more than one abiotic factor.
The big idea
Sample at random to estimate a whole area, and sample along a line to see how a community changes.
Always scale the mean up by area, and say that the result is an estimate.
Fieldwork
Fieldwork
-
Quadrat
- square frame
- known area
- count or percentage cover
-
Random sampling
- random coordinates
- avoids bias
- many quadrats
-
Belt transect
- line and belt
- regular intervals
- gradient
- abiotic factors
-
Calculations
- mean
- estimate for whole area
- percentage cover
-
Evaluation
- sample size
- bias
- identification
- controls
Summary and exam focus
- A quadrat is a square frame that marks out a known area, and the organisms inside it are counted or their percentage cover is estimated.
- Random sampling, with coordinates from random numbers, removes bias and gives a representative sample, and a belt transect shows how organisms change along an environmental gradient.
- The number in a whole area is the mean per quadrat multiplied by the area of the habitat divided by the area of one quadrat, and it is only an estimate.
- Percentage cover is the number of squares covered divided by the total number of squares, multiplied by 100, and the mean is the total divided by the number of quadrats.
- Reliability improves with more quadrats, random placement, repeats and control of variables, and a correlation shows a link but does not prove cause.
Exam focus
Describe how you would use quadrats to estimate the number of daisy plants on a school field. (4 marks) (4 marks)
Put the method in order and give the random step its reason. Say how you would choose each position (random coordinates from two tape measures), what you would record (the number of daisies in each quadrat), how many quadrats you would use, and finish with the calculation: the mean per quadrat multiplied by the number of quadrats that would fit in the field.
Key terms
The words this lesson expects you to use. Each one is linked from the first place it appears above.
- Quadrat
- A square frame that marks out a known area, used to sample the organisms in a habitat.
- Sample
- A small part of a habitat or population that is studied to represent the whole.
- Random sampling
- Choosing the positions to sample by chance, such as with random numbers, so that there is no bias.
- Belt transect
- A strip of fixed width along a line across a habitat, sampled with quadrats at regular intervals.
- Abundance
- The number of individuals of a species in a given area.
- Percentage cover
- The percentage of the area of a quadrat that is covered by a species.
- Mean
- The total of all the values divided by the number of values.
- Bias
- A fault in sampling or measuring that makes results favour one outcome.
- Distribution
- Where in a habitat a species is found, and how it is spread out.
- Correlation
- A relationship between two variables, shown by a scatter graph.
You've finished the notes
Check your understanding
Test yourself while it is fresh. Start with the flashcards, then try the exam questions.
Something here looks wrong?
Tell us what and we will go and look. It goes to whoever writes these pages, nobody else, and we do not ask who you are — so there is nothing to sign and nothing comes back to you.