Exam questions · Biology
Ecosystems and Communities
- 32 exam questions
- 105 marks
- 32 quick checks
Levels of Organisation and Interdependence
Just this lesson-
1 Name [1 mark]
A field contains one hundred rabbits. Name the level of organisation that describes all of the rabbits in the field.
Show answerHide answer
Model answer
A population.
Mark scheme
- Population — 1 mark
-
2 Name [4 marks]
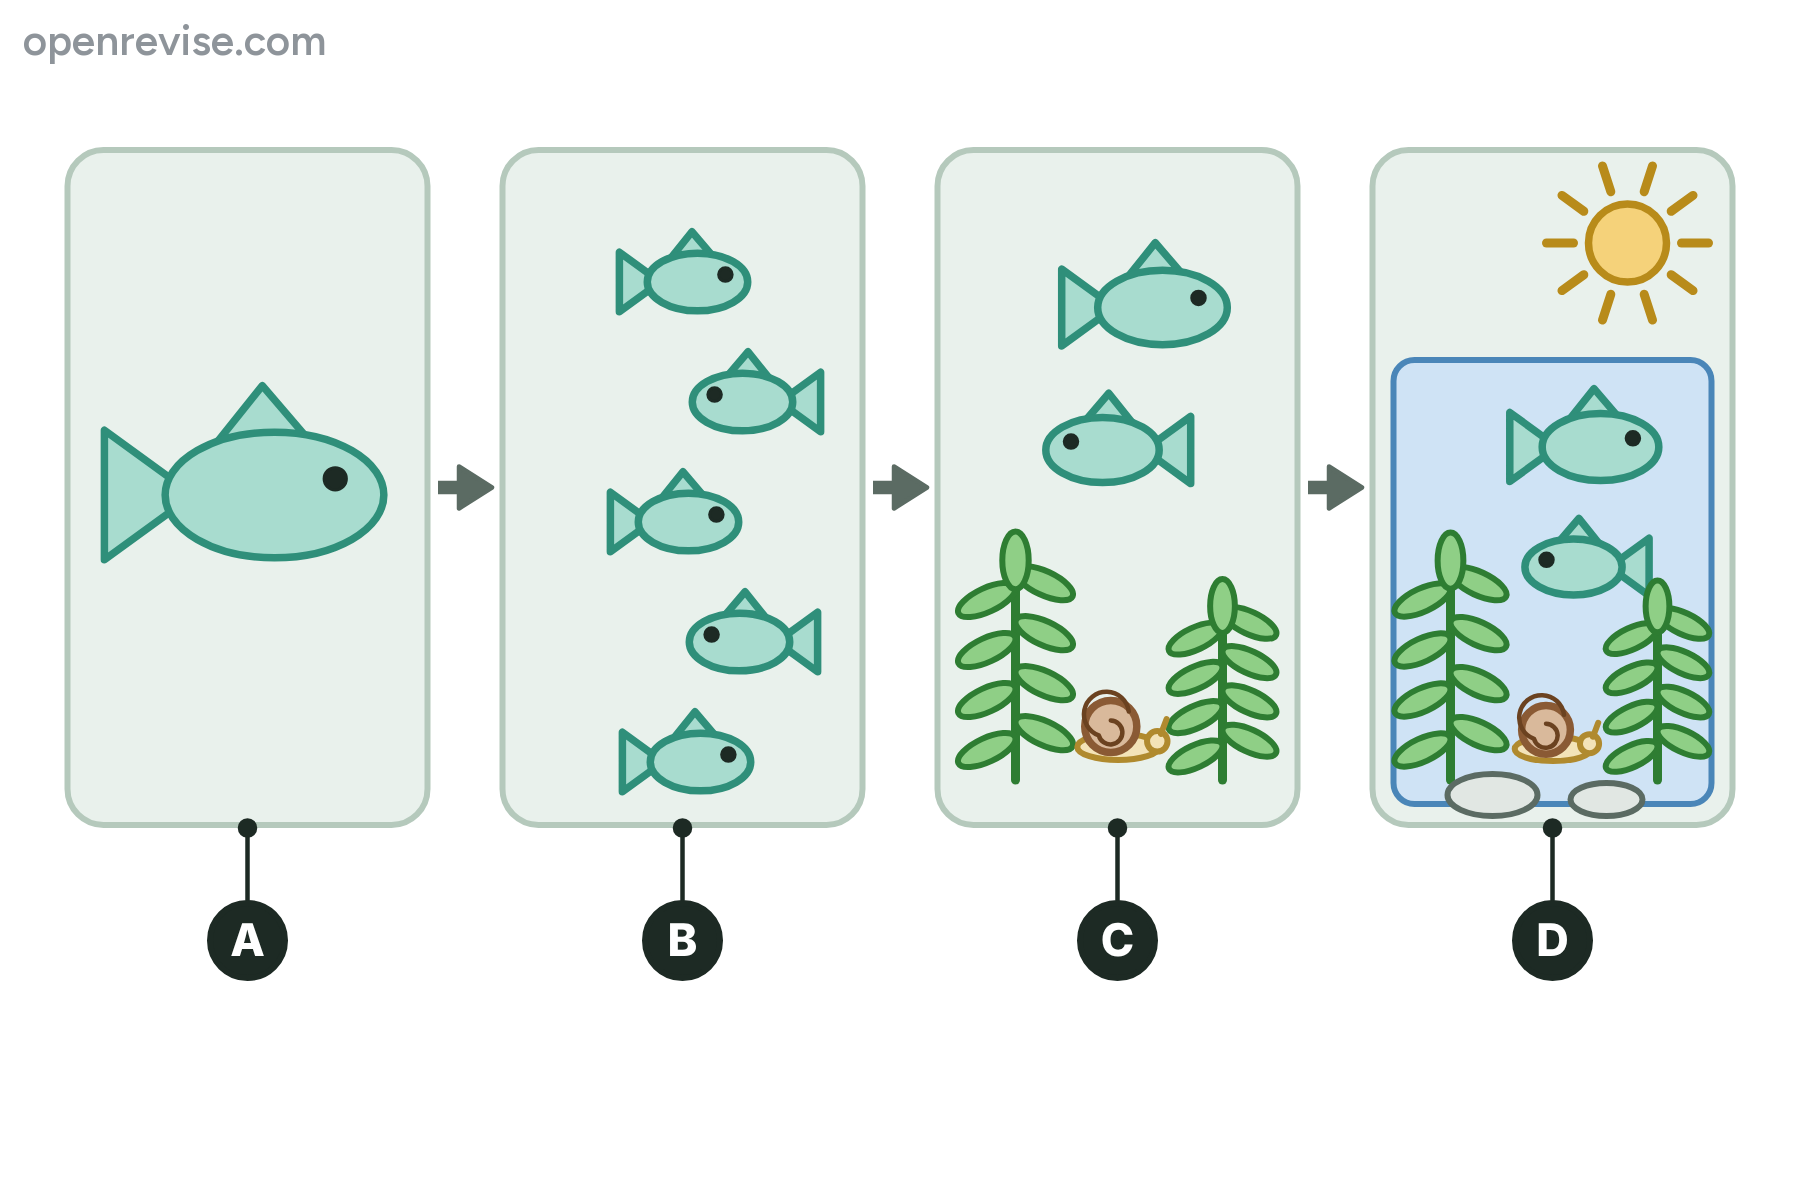
The diagram shows four levels of organisation in a pond. Name the level shown in each of A, B, C and D.
Show answerHide answer
Model answer
A is an individual organism. B is a population. C is a community. D is an ecosystem.
Mark scheme
- A: individual (organism) — 1 mark
- B: population — 1 mark
- C: community — 1 mark
- D: ecosystem — 1 mark
-
3 Describe [2 marks]
Describe the difference between a community and an ecosystem.
Show answerHide answer
Model answer
A community is all the populations of different species living in the same place. An ecosystem is the community together with the non-living (abiotic) factors of the environment, such as light, temperature and water, which interact with it.
Mark scheme
- A community is all the living organisms (populations of different species) in an area — 1 mark
- An ecosystem also includes the non-living factors — 1 mark
-
4 Explain [3 marks]
A food chain in a woodland is: oak leaves, caterpillar, blue tit, sparrowhawk. Explain what is meant by interdependence, using this food chain as an example.
Show answerHide answer
Model answer
Interdependence means that the organisms in a community depend on each other. The caterpillar depends on oak leaves for food, the blue tit depends on caterpillars, and the sparrowhawk depends on blue tits. If the caterpillars died out, the blue tits would lose their food, and the number of sparrowhawks could fall too.
Mark scheme
- Organisms in a community depend on each other (for food or other needs) — 1 mark
- A correct link from the food chain, such as blue tits depend on caterpillars for food — 1 mark
- A consequence of losing one species for another — 1 mark
-
5 Explain [3 marks]
A tapeworm lives in the small intestine of a pig. Explain why this is an example of parasitism and not mutualism.
Show answerHide answer
Model answer
The tapeworm is a parasite and the pig is its host. The tapeworm benefits because it absorbs the digested food in the pig's gut. The pig is harmed, because it loses some of its food and may lose weight. In mutualism both organisms would benefit.
Mark scheme
- The tapeworm lives in or on the pig and feeds from it (parasite and host) — 1 mark
- The tapeworm benefits (gets food or shelter) — 1 mark
- The pig is harmed (loses nutrients), but in mutualism both organisms benefit — 1 mark
-
6 Explain [4 marks]
Clover is a plant with nitrogen-fixing bacteria in nodules on its roots. Explain why this relationship is an example of mutualism.
Show answerHide answer
Model answer
Mutualism is a relationship in which both organisms benefit. The bacteria convert nitrogen gas from the air into nitrogen compounds such as nitrates, which the clover uses to make proteins, so the plant grows better. In return the clover gives the bacteria sugars, which they use for energy, and a safe place to live in its nodules.
Mark scheme
- Mutualism means both organisms benefit — 1 mark
- The bacteria make nitrogen compounds (nitrates) from nitrogen gas — 1 mark
- The plant uses these to make protein (so benefits) — 1 mark
- The plant gives the bacteria sugars or shelter (so they benefit) — 1 mark
-
7 Explain [4 marks]
Bees feed on nectar from foxglove flowers. Explain how the bees and the foxgloves depend on each other, and what would happen to the foxglove population if the bees disappeared.
Show answerHide answer
Model answer
The bees depend on the flowers for food, because they collect nectar. The foxgloves depend on the bees for pollination, because the bees carry pollen from one flower to another as they feed. This is a mutualistic relationship and an example of interdependence. If the bees disappeared, the flowers would not be pollinated, so fewer seeds would be made and the foxglove population would fall.
Mark scheme
- Bees depend on the flowers for nectar (food) — 1 mark
- Flowers depend on the bees for pollination (transfer of pollen) — 1 mark
- Without pollination fewer seeds would be produced — 1 mark
- The foxglove population would decrease — 1 mark
-
8 Explain [6 marks]
Explain, using named examples, how the survival of one species in a community can depend on other species. You should include parasitism and mutualism in your answer.
Show answerHide answer
Model answer
Organisms in a community are interdependent. Some depend on others for food: a hare depends on grass, and a fox depends on hares, so the loss of the grass would reduce both populations. In parasitism the parasite depends on its host for food and shelter and the host is harmed. For example, a tapeworm absorbs the digested food in the gut of its host, and a flea feeds on the blood of a dog, so these parasites could not survive without their hosts. In mutualism both organisms benefit, so each depends on the other. Nitrogen-fixing bacteria in root nodules get sugars from a pea plant, while the plant gets nitrates to make protein. Bees get nectar from flowers, while the flowers get pollinated and can make seeds. If one of these partners was lost the other would be less likely to survive, so the survival of a species can depend on others.
Mark scheme
- Interdependence explained for food, with a named food chain example — 1 mark
- Parasitism defined: one organism benefits and the other is harmed — 1 mark
- A named parasite example, with how it benefits (tapeworm, flea or mistletoe) — 1 mark
- Mutualism defined: both organisms benefit — 1 mark
- A named mutualism example with what each organism gains (nodules, pollinators or cleaner fish) — 1 mark
- A link to survival, such as the loss of one partner reducing the survival of the other — 1 mark
Quick check
-
1
All of the fish of one species living in a lake are best described as which level of organisation?
Show answerHide answer
B: A population
One species living in the same place at the same time is a population.
-
2
Which of these is an example of an ecosystem?
Show answerHide answer
D: A pond with its living organisms and its non-living surroundings
An ecosystem includes the living community and the non-living factors, such as a pond with its water, light and temperature.
-
3
Why is a woodland community called interdependent?
Show answerHide answer
A: Its organisms depend on each other
Interdependence means that the organisms in a community rely on each other for food, shelter, pollination and other needs.
-
4
A flea feeds on the blood of a dog. What kind of relationship is this?
Show answerHide answer
C: Parasitism
The flea benefits and the dog is harmed, which is parasitism.
-
5
In which relationship do both organisms benefit?
Show answerHide answer
B: A cleaner fish and a large fish
In mutualism both organisms gain, for example bees and flowers or cleaner fish and larger fish.
-
6
What does a pea plant gain from the nitrogen-fixing bacteria in its root nodules?
Show answerHide answer
D: Nitrogen compounds to make protein
The bacteria turn nitrogen gas into nitrogen compounds such as nitrates, which the plant uses to make proteins.
-
7
What does mistletoe take from the tree it grows on?
Show answerHide answer
A: Water and mineral ions
Mistletoe is a parasite that takes water and mineral ions from its host tree.
-
8
Foxes in a field are killed by a disease. What is the most likely effect on the rabbits at first?
Show answerHide answer
C: Their numbers rise
With fewer predators, fewer rabbits are eaten, so the population rises until food becomes the limit.
Abiotic and Biotic Factors
Just this lesson-
1 State [2 marks]
State two abiotic factors that can affect the species living in a pond.
Show answerHide answer
Model answer
Any two of: temperature, light, water (depth or availability), pollutants, oxygen concentration or pH.
Mark scheme
- First abiotic factor — 1 mark
- Second abiotic factor — 1 mark
-
2 Explain [3 marks]
Very few plants grow on the floor of a dense pine forest. Explain why.
Show answerHide answer
Model answer
The tall trees block most of the light from reaching the forest floor. Plants need light for photosynthesis, so the plants on the floor cannot make enough food to grow. The trees also compete with them for water and mineral ions, so only a few shade-tolerant species survive.
Mark scheme
- The tree canopy blocks light — 1 mark
- Plants need light for photosynthesis, so they cannot make enough food — 1 mark
- Competition for water or mineral ions from the trees — 1 mark
-
3 Describe [3 marks]
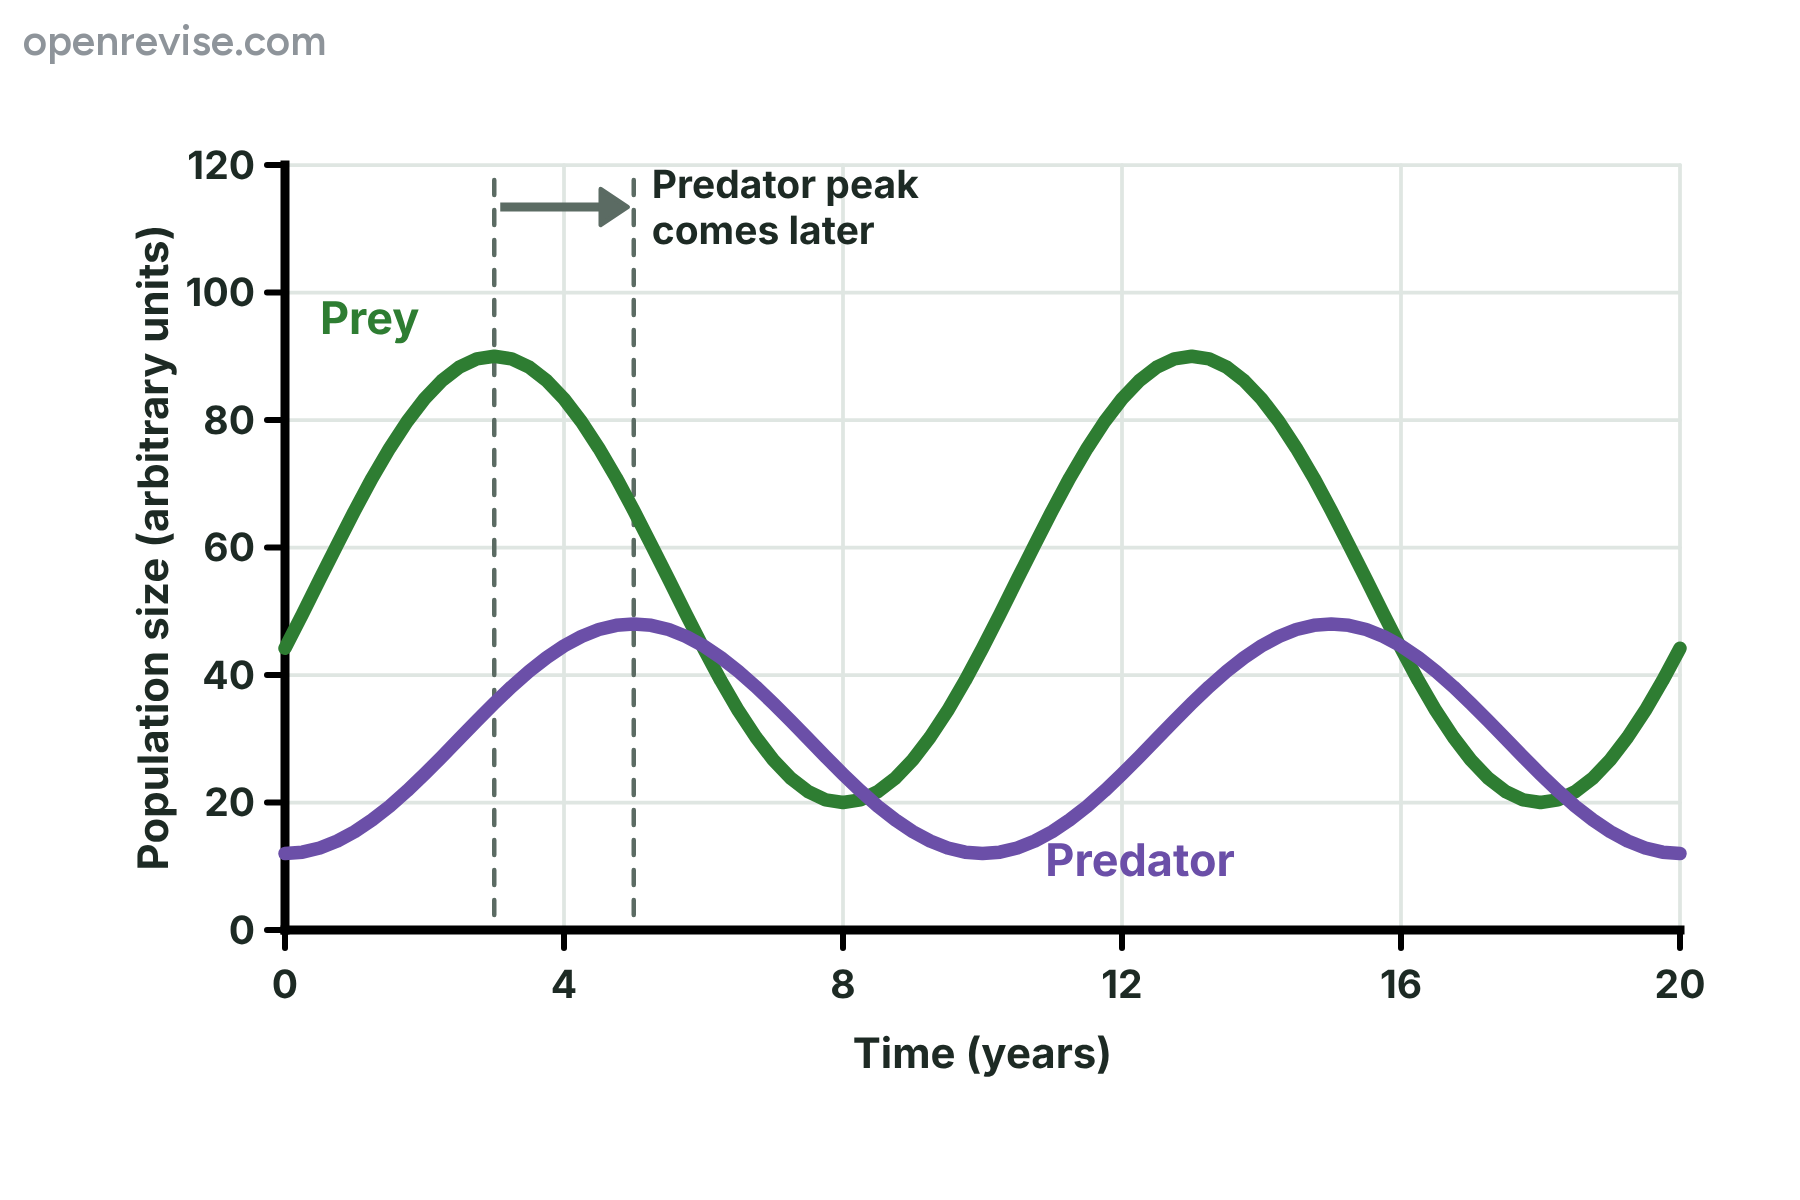
The graph shows the sizes of a prey population and a predator population over 20 years. Describe the pattern shown by the graph.
Show answerHide answer
Model answer
Both populations rise and fall in a repeating cycle, with a peak about every 10 years. The prey population peaks first, at about 90 units in year 3, and the predator population peaks about 2 years later, at about 48 units in year 5. The predator population is always smaller than the prey population.
Mark scheme
- Both populations rise and fall in a repeating (cyclical) pattern — 1 mark
- The predator peak comes after the prey peak (about 2 years later, with figures) — 1 mark
- There are fewer predators than prey — 1 mark
-
4 Explain [3 marks]
Use the graph to explain why the number of predators falls between year 5 and year 10.
Show answerHide answer
Model answer
After year 5 the number of prey is falling, because there are many predators eating them. With less prey to eat, there is less food for the predators, so many starve or fail to breed and the predator population falls.
Mark scheme
- Prey numbers are falling (more eaten by the many predators) — 1 mark
- So less food is available for the predators — 1 mark
- So predators starve or breed less, and their numbers fall — 1 mark
-
5 Calculate [2 marks]
In a predator-prey graph, the prey population falls from a peak of 90 units to a low of 20 units. Calculate the percentage decrease in the prey population. Give your answer to the nearest whole number.
Show answerHide answer
Model answer
Change = 90 - 20 = 70 units. Percentage decrease = \(70 \div 90 \times 100 = 77.8\%\), which is 78% to the nearest whole number.
Mark scheme
- \(70 \div 90 \times 100\) — 1 mark
- 78% — 1 mark
-
6 Explain [4 marks]
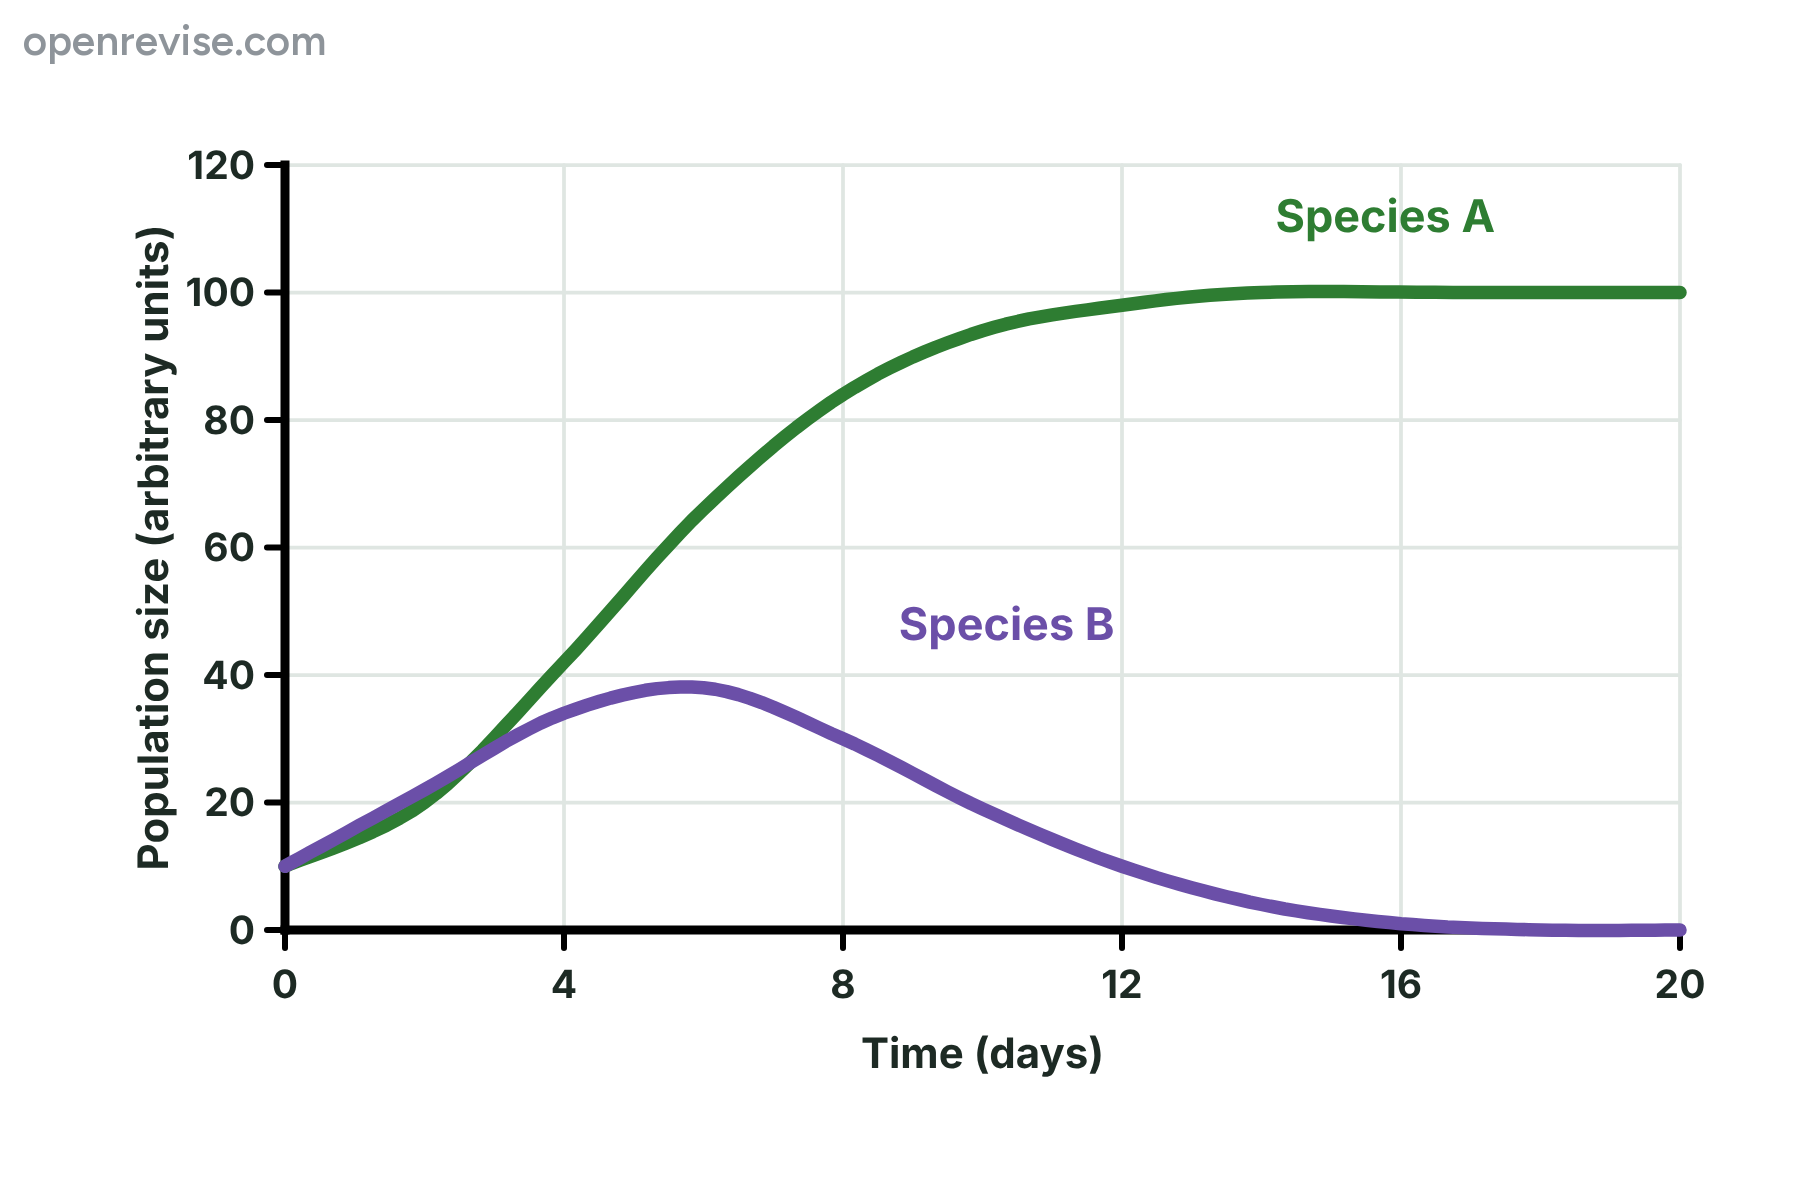
Two species of microorganism, A and B, were grown together in the same container with a limited supply of the same food. The graph shows the results. Describe what happened to each species and explain the pattern.
Show answerHide answer
Model answer
Species A increased and then stayed constant at about 100 units from day 14. Species B increased to about 38 units by day 6 but then fell and had almost died out by day 18. The two species were competing for the same limited food. Species A was better at getting the food, so it survived and reproduced more, and species B did not get enough food, so it declined.
Mark scheme
- Species A increased and then levelled off at about 100 — 1 mark
- Species B increased at first, then fell to almost zero — 1 mark
- The species competed for the same limited food — 1 mark
- Species A was better at getting the food (outcompeted B), so B declined — 1 mark
-
7 Explain [3 marks]
A power station burns coal and releases sulfur dioxide, which dissolves in rain. Explain how this could change the community of organisms in a nearby woodland.
Show answerHide answer
Model answer
Sulfur dioxide is a pollutant, and it makes the rain acidic. Acid rain damages the leaves and roots of trees and acidifies the soil and streams, so sensitive plants and animals die. The number of species in the woodland falls, and the animals that depended on them for food are affected too.
Mark scheme
- Sulfur dioxide is a pollutant that makes rain acidic — 1 mark
- Sensitive plants or animals are damaged or die — 1 mark
- Fewer species, and the animals that depend on them are affected — 1 mark
-
8 Explain [6 marks]
Explain how abiotic and biotic factors can affect the species found in a community. Use examples in your answer.
Show answerHide answer
Model answer
Abiotic factors are the non-living parts of the environment. Temperature affects the enzymes in organisms, so very cold or very hot places support few species. Light is needed for photosynthesis, so on a woodland floor under a thick canopy only shade-tolerant plants survive. Water is needed by all organisms, so in a desert only plants such as cacti that store water can live there. Pollutants such as sulfur dioxide kill sensitive species, so the number of species falls. Biotic factors are living. In competition, organisms fight for limited resources such as food or light, so the species that is better adapted survives and the other declines. In predation, the number of predators rises and falls just after the number of their prey, so predators and prey are linked in a cycle. Disease can also reduce a population. All of these decide which species live in a community and how many there are.
Mark scheme
- Abiotic factors defined as non-living, with one named example and its effect (temperature) — 1 mark
- A second abiotic example with its effect on species (light, water or a pollutant) — 1 mark
- A third abiotic example, or a clear effect on the number of species — 1 mark
- Biotic factors defined as living, with competition and its effect on populations — 1 mark
- Predation and its effect, such as the predator-prey cycle — 1 mark
- A conclusion linking the factors to which species are present and how many — 1 mark
Quick check
-
1
Which of these is an abiotic factor?
Show answerHide answer
C: Light intensity
Light is a non-living factor. Predation, competition and disease involve living organisms, so they are biotic.
-
2
Which of these is a biotic factor?
Show answerHide answer
A: Competition for food
Competition between organisms is a biotic factor because it involves living things.
-
3
In a predator-prey cycle, which population reaches its peak first?
Show answerHide answer
B: The prey
The prey peak comes first, because the predators increase only after there is plenty of prey to eat.
-
4
Why does the number of prey fall after the number of predators rises?
Show answerHide answer
D: More prey are eaten by the extra predators
More predators eat more prey, so the prey population decreases.
-
5
What do plants in a woodland compete for?
Show answerHide answer
A: Light, water, mineral ions and space
Plants compete for light, water, mineral ions from the soil and space.
-
6
In a graph, a prey peak is at year 3 and the next predator peak is at year 5. What does this show?
Show answerHide answer
C: The predator numbers follow the prey numbers
The predator numbers lag behind the prey numbers, because the predators need time to increase when food becomes plentiful.
-
7
A prey population falls from 80 to 20. What is the percentage decrease?
Show answerHide answer
D: 75%
The change is 60, and 60 divided by 80 is 0.75, which is 75%.
-
8
How can a pollutant change a community?
Show answerHide answer
B: It kills sensitive species
Sensitive species die out when a pollutant is added to their environment, so the number of species falls.
Fieldwork: Quadrats and Transects
Just this lesson-
1 Name [1 mark]
Name the piece of equipment used to mark out a known area when sampling plants in a field.
Show answerHide answer
Model answer
A quadrat.
Mark scheme
- Quadrat — 1 mark
-
2 Explain [2 marks]
A student places each quadrat at a position chosen using random numbers. Explain why.
Show answerHide answer
Model answer
Using random numbers means that the student does not choose the places deliberately, so there is no bias. Every part of the area has the same chance of being sampled, so the sample is representative of the whole area.
Mark scheme
- To avoid bias (every position has an equal chance of being chosen) — 1 mark
- So that the sample is representative of the whole area — 1 mark
-
3 Describe [4 marks]
Describe how you would use quadrats to estimate the number of daisy plants on a school field.
Show answerHide answer
Model answer
Lay two tape measures at right angles along two sides of the field. Use random numbers to get coordinates, and place a quadrat at each pair of coordinates. Count the number of daisy plants inside each quadrat, using at least ten quadrats. Calculate the mean number of daisies per quadrat, then multiply it by the area of the field divided by the area of one quadrat.
Mark scheme
- Quadrats placed at random, using random number coordinates on two tapes — 1 mark
- Count the daisies in each quadrat — 1 mark
- Use many quadrats, and calculate the mean per quadrat — 1 mark
- Multiply the mean by (area of field divided by area of quadrat) — 1 mark
-
4 Calculate [3 marks]
A student counted dandelion plants in eight randomly placed quadrats, each 0.5 m by 0.5 m. The counts were 6, 4, 9, 5, 7, 3, 8 and 6. The field has an area of 250 m\(^2\). Estimate the number of dandelion plants in the field.
Show answerHide answer
Model answer
Total = 48, so the mean = \(48 \div 8 = 6\) per quadrat. Area of a quadrat = \(0.5 \times 0.5 = 0.25\ \text{m}^2\). Number of quadrats that fit in the field = \(250 \div 0.25 = 1000\). Estimated number = \(6 \times 1000 = 6000\) dandelions.
Mark scheme
- Mean = \(48 \div 8 = 6\) — 1 mark
- \(250 \div 0.25 = 1000\) — 1 mark
- \(6 \times 1000 = 6000\) — 1 mark
-
5 Calculate [2 marks]
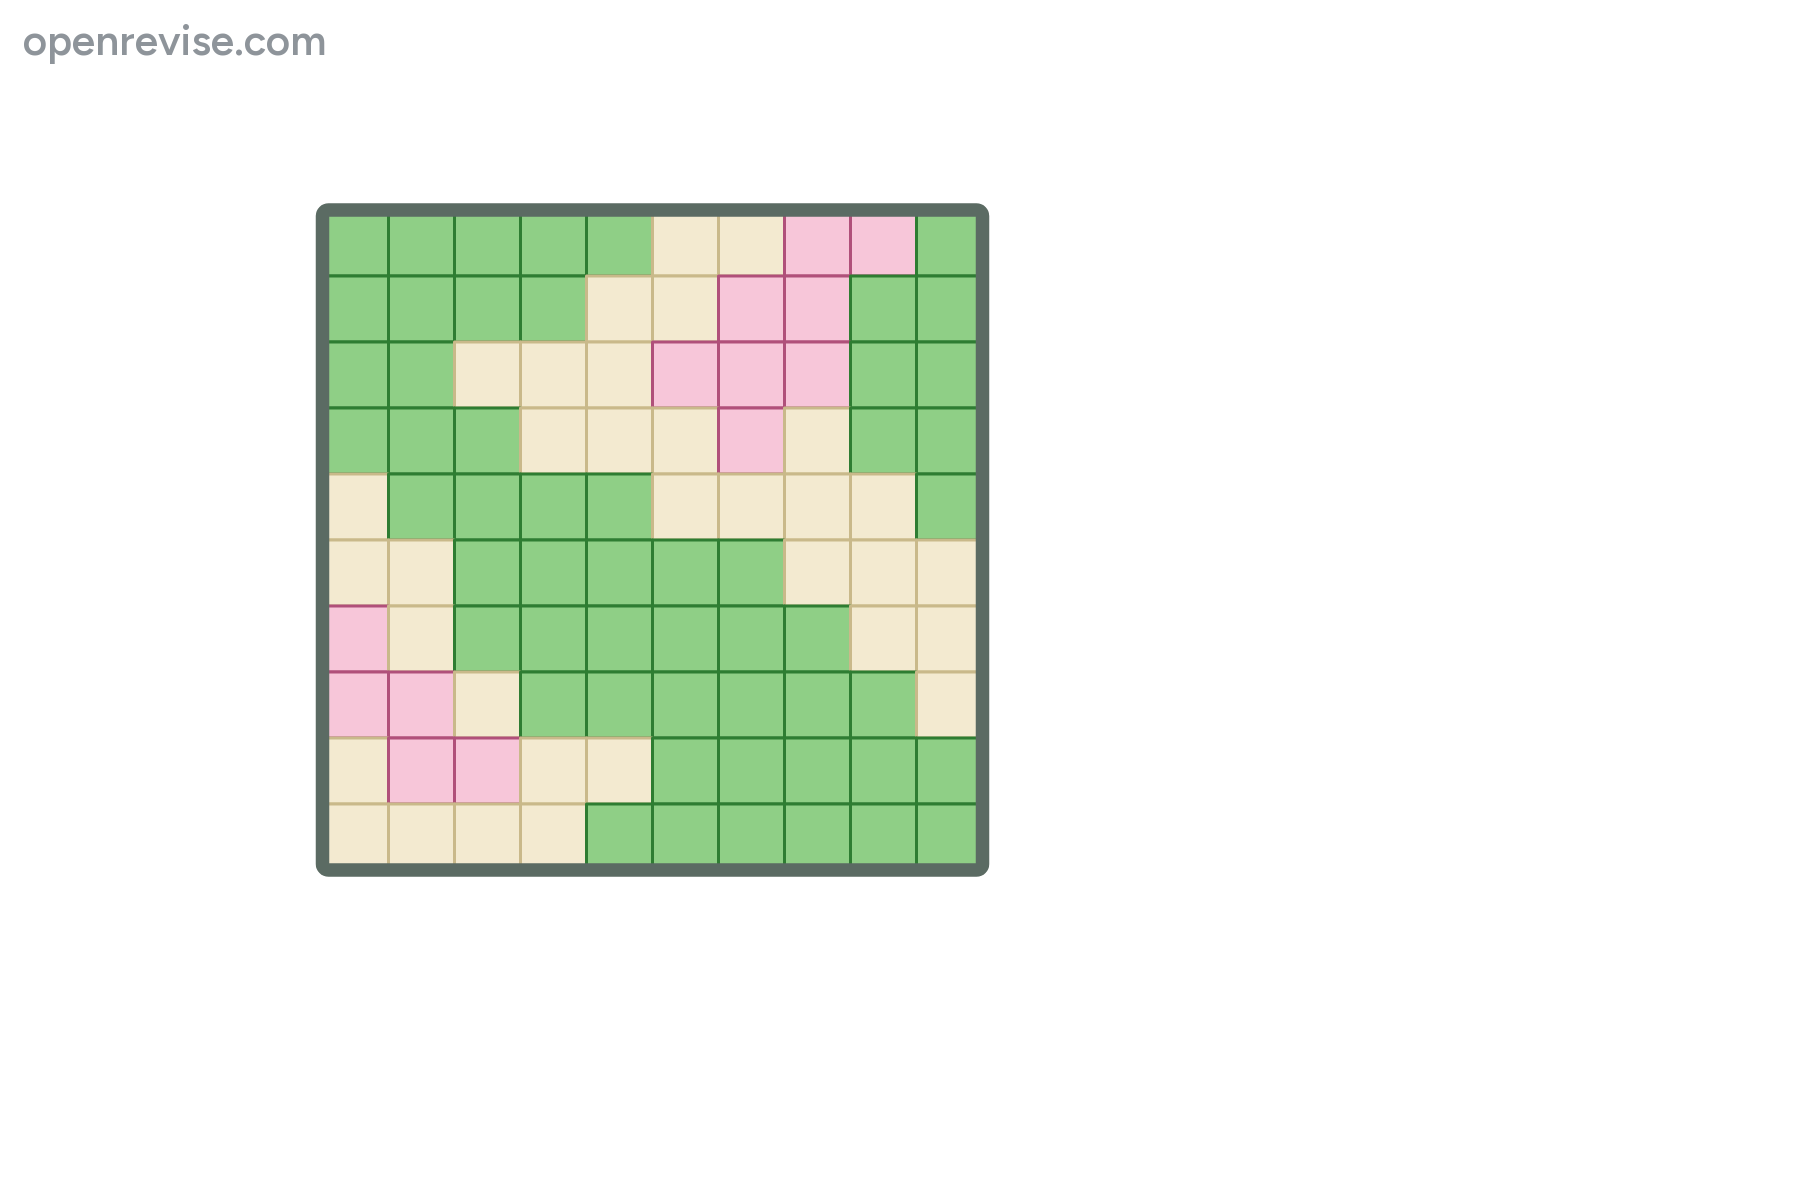
The diagram shows a quadrat with 100 squares. The pink squares are clover, the green squares are grass and the cream squares are bare soil. Calculate the percentage cover of clover, and the percentage of the quadrat that is bare soil.
Show answerHide answer
Model answer
There are 13 pink squares, so the clover covers 13%. There are 33 cream squares, so 33% of the quadrat is bare soil.
Mark scheme
- Clover = 13% — 1 mark
- Bare soil = 33% — 1 mark
-
6 Explain [3 marks]
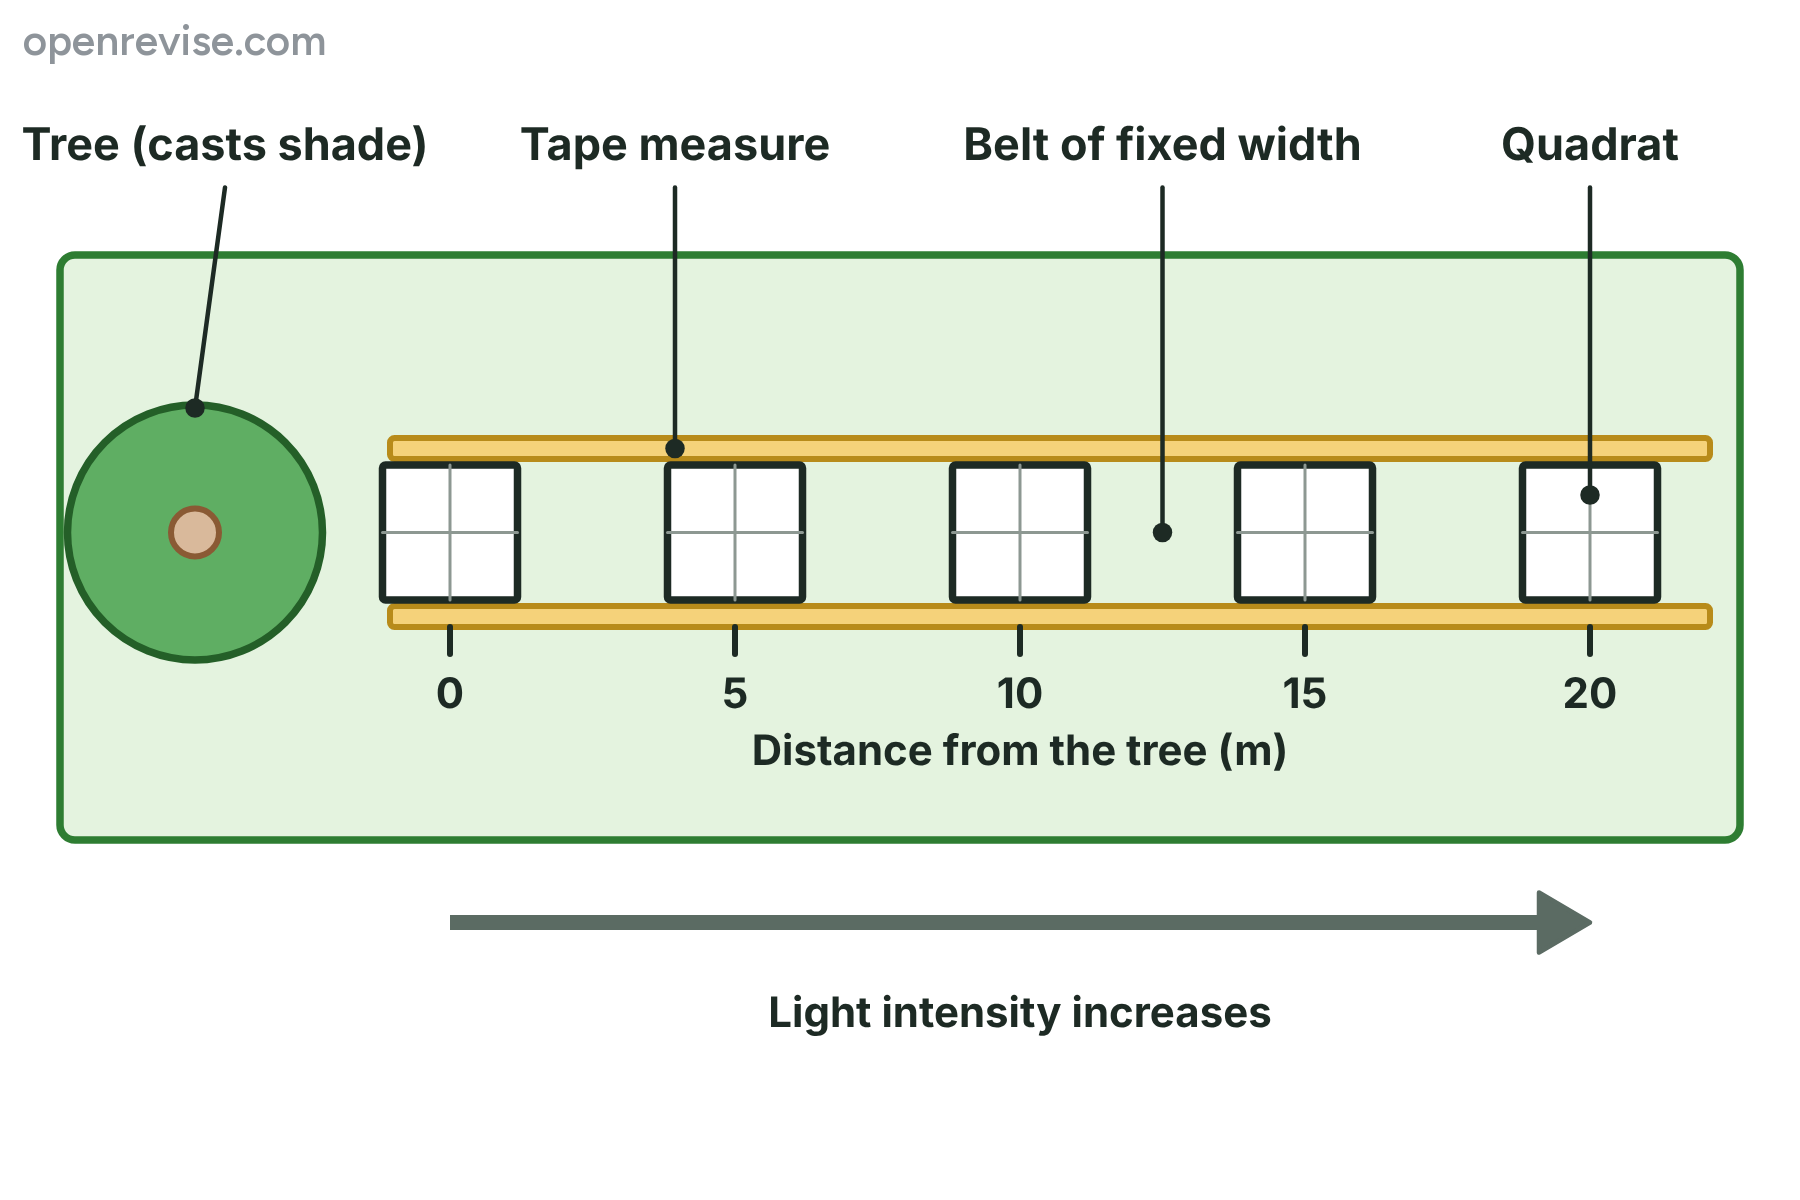
A student investigated how the plants in a field change with distance from a tree, as shown in the diagram. Explain why the student used a belt transect rather than quadrats placed at random.
Show answerHide answer
Model answer
The light intensity changes gradually from the shade of the tree to the open field. A belt transect samples the quadrats in order along this gradient at regular intervals, so the student can see how the plants change as the light intensity changes. Random quadrats would not show how the pattern changes along the line.
Mark scheme
- The environment changes steadily (a gradient) with distance from the tree — 1 mark
- Quadrats at regular intervals along a line sample the whole gradient in order — 1 mark
- This shows how the distribution of plants changes with the abiotic factor — 1 mark
-
7 Describe [4 marks]
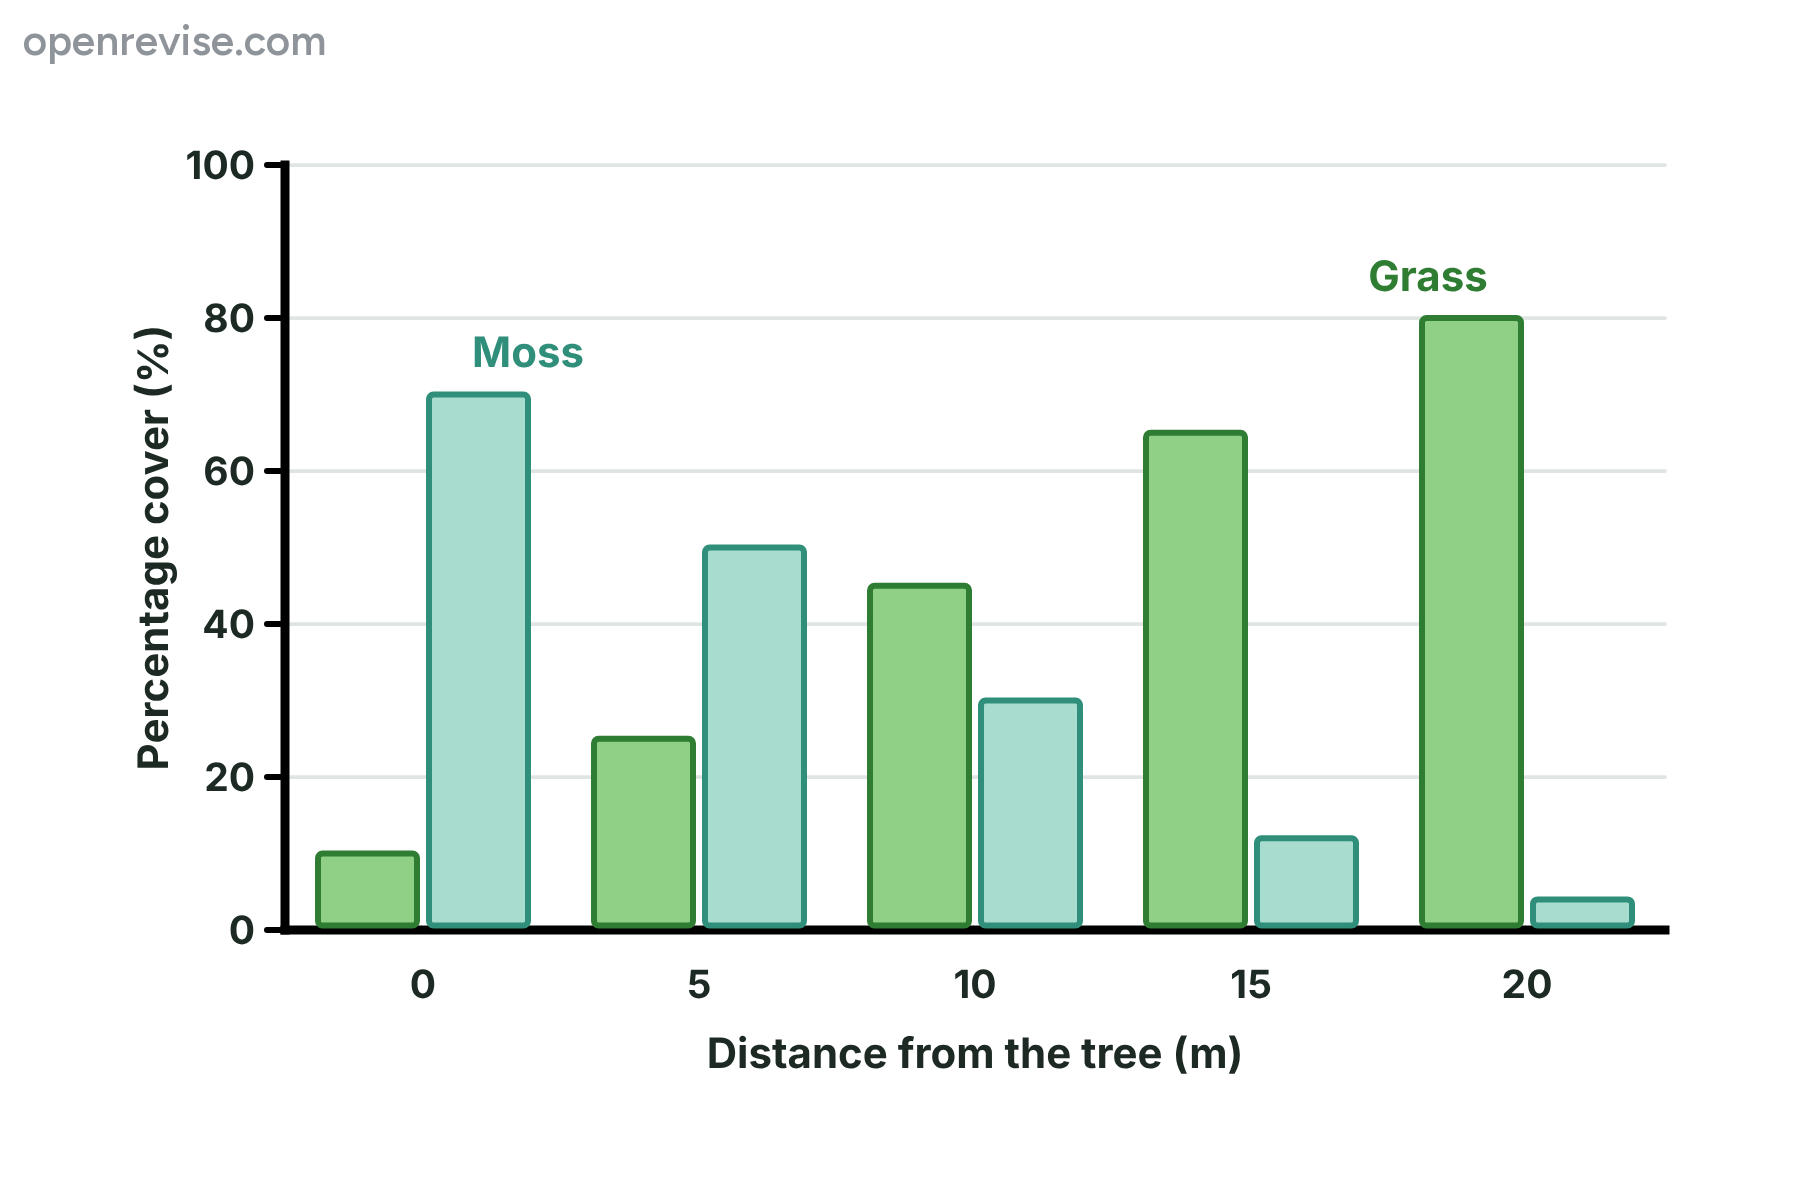
The bar chart shows the percentage cover of grass and moss along a transect from the base of a tree. Describe the results, and suggest an explanation for the distribution of the moss.
Show answerHide answer
Model answer
As the distance from the tree increases, the percentage cover of grass increases from 10% to 80%, while the cover of moss decreases from 70% to 4%. Moss is most common close to the tree. A possible explanation is that the tree casts shade and the soil near it is damper, and moss is better adapted to low light and damp conditions than the grass.
Mark scheme
- Grass cover increases with distance (10% to 80%) — 1 mark
- Moss cover decreases with distance (70% to 4%) — 1 mark
- Suggestion that there is less light (shade) or more moisture near the tree — 1 mark
- Moss is better adapted to shade or damp conditions than grass — 1 mark
-
8 Evaluate [6 marks]
A student wanted to compare the number of buttercup plants on two fields. In each field she placed three quadrats where there seemed to be buttercups, counted the plants, and compared the totals. Evaluate her method and suggest how she could improve it.
Show answerHide answer
Model answer
Placing the quadrats where there seemed to be buttercups introduces bias, because the places are not representative of the whole field and will overestimate the number of buttercups. The sample of three quadrats is also too small, so the results are not reliable and chance could affect them. She should place the quadrats using random coordinates, so that every part of the field has an equal chance, and use many more quadrats, at least ten in each field, and then calculate the mean per quadrat. She should use the same size of quadrat, count at the same time of year and day, and compare the mean number of buttercups per square metre, or scale up to the area of the field, so that fields of different sizes can be compared fairly. She should also use a key so that buttercups are not confused with other yellow flowers.
Mark scheme
- Placing quadrats deliberately where buttercups are seen is biased — 1 mark
- Random coordinates (random numbers) should be used instead — 1 mark
- Three quadrats is a small sample, so the results are unreliable — 1 mark
- Use many more quadrats and calculate a mean — 1 mark
- Control variables, such as the same quadrat size, time and counting method — 1 mark
- Compare means per square metre, or the estimated total for each field, and use an identification key — 1 mark
Quick check
-
1
What is the main reason for placing quadrats at random?
Show answerHide answer
C: It avoids bias in the sample
Random placement means every part of the area has the same chance of being sampled, which removes bias.
-
2
A belt transect is most useful for investigating which of these?
Show answerHide answer
A: How organisms change from shade to open ground
A transect samples along a line, so it shows how organisms change across a gradient, such as from shade into light.
-
3
The counts of a plant in five quadrats are 2, 6, 4, 5 and 3. What is the mean?
Show answerHide answer
D: 4
The total is 20, and 20 divided by 5 is 4.
-
4
How many 0.5 m by 0.5 m quadrats would fit into an area of 50 m\(^2\)?
Show answerHide answer
B: 200
A quadrat has an area of 0.25 m\(^2\), and 50 divided by 0.25 is 200.
-
5
A mean of 3 plants per quadrat was found using 1 m by 1 m quadrats in a field of 1200 m\(^2\). How many plants are estimated to be in the field?
Show answerHide answer
C: 3600
One quadrat is 1 m\(^2\), so 1200 quadrats fit in the field, and 3 times 1200 is 3600.
-
6
On a quadrat with 100 squares, 27 squares are covered by clover. What is the percentage cover of clover?
Show answerHide answer
A: 27%
Each square is 1%, so 27 squares are 27% cover.
-
7
Which of these would make quadrat results more reliable?
Show answerHide answer
D: Using more quadrats placed at random
A larger sample, with the quadrats placed at random, is more representative, so the results are more reliable.
-
8
A scatter graph of plant cover against light intensity shows a rising line of best fit. What does this show?
Show answerHide answer
B: A positive correlation between light and plant cover
The crosses rising from lower left to upper right show a positive correlation, which is a link but not proof of cause.
Energy Transfer and Pyramids of Biomass
Just this lesson-
1 Name [2 marks]
Name two ways in which energy is lost from a food chain between one trophic level and the next.
Show answerHide answer
Model answer
Any two of: heat from respiration, in waste such as faeces and urine, in parts that are not eaten such as bones.
Mark scheme
- First way of losing energy — 1 mark
- Second way of losing energy — 1 mark
-
2 Name [3 marks]
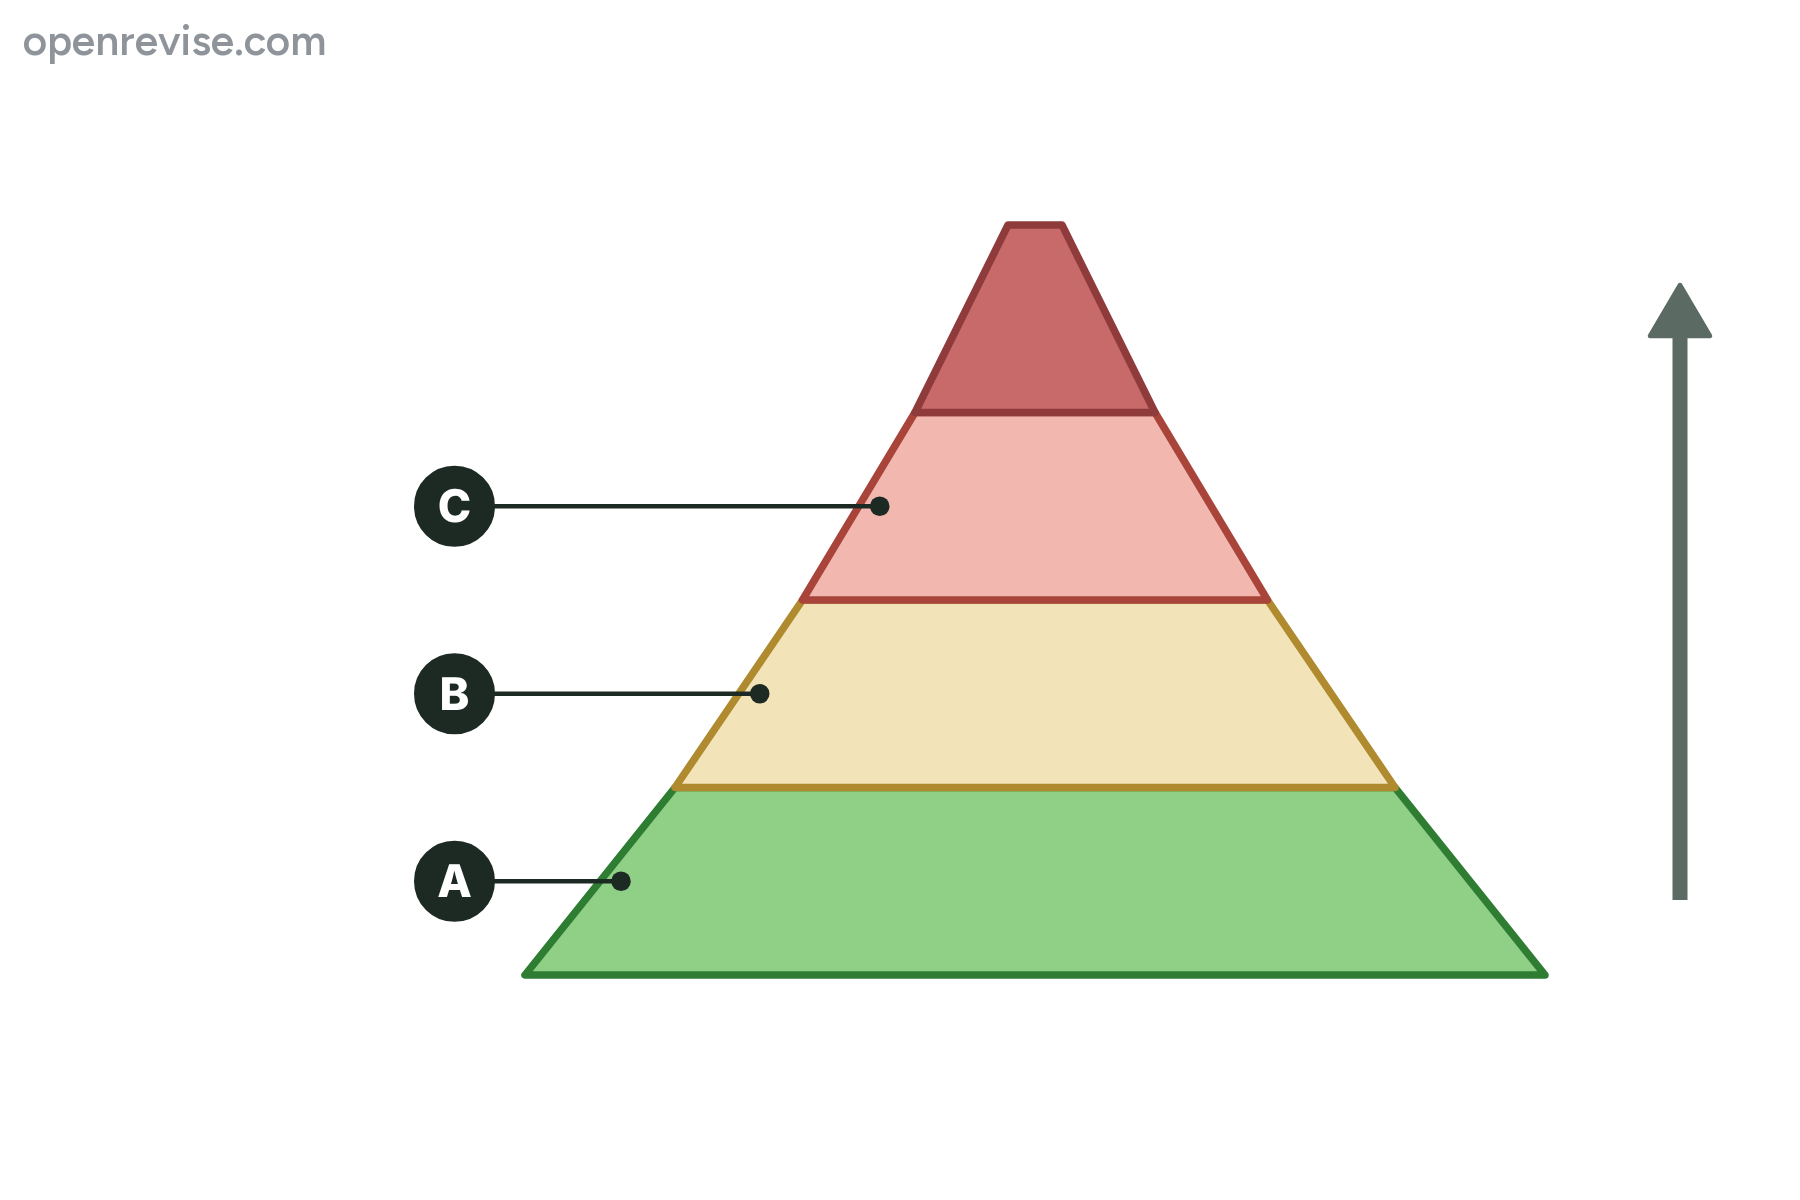
The diagram is a pyramid of biomass. Name the trophic levels A, B and C.
Show answerHide answer
Model answer
A is the producer(s), B is the primary consumer(s) and C is the secondary consumer(s).
Mark scheme
- A: producer — 1 mark
- B: primary consumer — 1 mark
- C: secondary consumer — 1 mark
-
3 Explain [3 marks]
Explain why a pyramid of biomass is always wider at the bottom than at the top.
Show answerHide answer
Model answer
The producers at the bottom contain the most biomass. At each step in the food chain some energy is lost, as heat from respiration, in waste and in parts that are not eaten. Less energy is transferred to the next level, so less biomass can be made, and each level has less biomass than the one below it.
Mark scheme
- Producers have the most biomass (the base) — 1 mark
- Energy is lost at each trophic level (with a named way, such as respiration or waste) — 1 mark
- So there is less energy and less biomass at each higher level — 1 mark
-
4 Calculate [2 marks]
The grass in a field contains 25 000 kJ of energy per square metre per year. The primary consumers that eat the grass gain 2 000 kJ of energy in their biomass. Calculate the efficiency of the energy transfer from the grass to the primary consumers.
Show answerHide answer
Model answer
Efficiency = \(2000 \div 25000 \times 100 = 8\%\).
Mark scheme
- \(2000 \div 25000\) (equation with numbers) — 1 mark
- 8% — 1 mark
-
5 Calculate [3 marks]
A food chain has the following biomass at each trophic level: producers 640 g per m\(^2\), primary consumers 80 g per m\(^2\), secondary consumers 6 g per m\(^2\). Calculate the percentage of the biomass transferred (a) from the producers to the primary consumers and (b) from the primary consumers to the secondary consumers. State which transfer is less efficient.
Show answerHide answer
Model answer
(a) \(80 \div 640 \times 100 = 12.5\%\). (b) \(6 \div 80 \times 100 = 7.5\%\). The transfer from primary consumers to secondary consumers is less efficient.
Mark scheme
- (a) 12.5% — 1 mark
- (b) 7.5% — 1 mark
- Primary to secondary consumers is less efficient — 1 mark
-
6 Explain [4 marks]
Explain why food chains rarely have more than five trophic levels.
Show answerHide answer
Model answer
Energy is lost at each trophic level, as heat from respiration, in waste such as faeces and urine, and in parts of the organisms that are not eaten. This means that less energy is available at each higher level. By the fifth level, so little energy is left that it cannot support a population that is big enough to survive, so there is no sixth level.
Mark scheme
- Energy is lost at each trophic level — 1 mark
- A named way of losing energy (heat from respiration, waste, parts not eaten) — 1 mark
- Less energy (and biomass) is available at each higher level — 1 mark
- Not enough energy left to support another viable population after four or five levels — 1 mark
-
7 Calculate [4 marks]
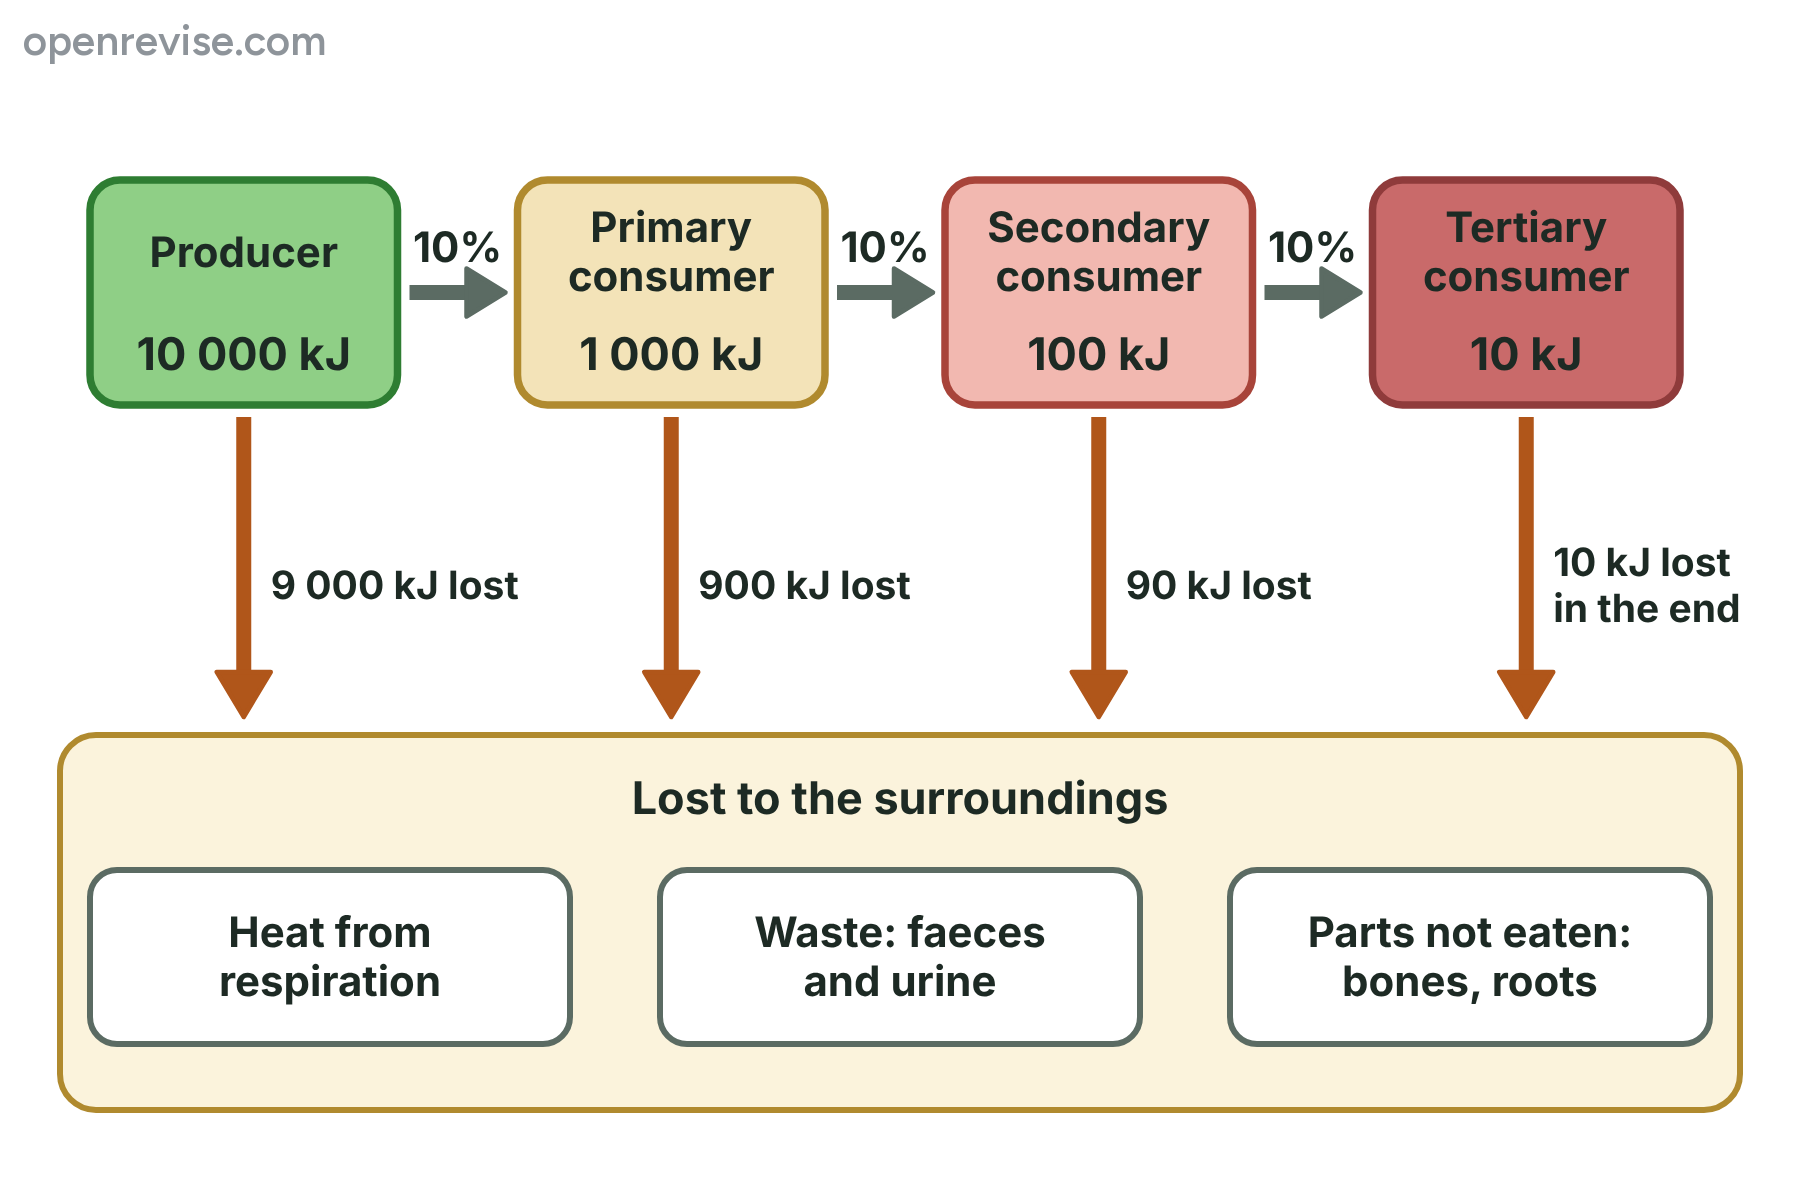
The diagram shows the energy in each trophic level of a food chain. (a) Calculate the efficiency of the energy transfer from the primary consumers to the secondary consumers. (2 marks) (b) Explain two ways in which the 900 kJ is lost. (2 marks)
Show answerHide answer
Model answer
(a) \(100 \div 1000 \times 100 = 10\%\). (b) Some of the energy is released as heat during respiration, which the primary consumers use for movement and keeping warm. Some is lost in faeces and urine, or in parts of the primary consumers, such as bones, that are not eaten.
Mark scheme
- (a) \(100 \div 1000 \times 100\) — 1 mark
- (a) 10% — 1 mark
- (b) First way, such as heat from respiration, with a reason — 1 mark
- (b) Second way, such as faeces and urine, or parts not eaten — 1 mark
-
8 Explain [6 marks]
A farmer can use a field to grow wheat for people to eat, or to grow grass to feed beef cattle. Explain, in terms of energy transfer, why the field would provide food for more people if it is used to grow wheat.
Show answerHide answer
Model answer
Wheat is a producer, so people who eat it are primary consumers. This is a short food chain with only one energy transfer. If the field is used to grow grass for cattle, there is an extra trophic level: grass, cattle, people. At each transfer, much of the energy is lost. The cattle use energy in respiration, which is released as heat, for movement and for keeping warm. Some is lost in their faeces and urine, and some is stored in parts of the cow that people do not eat, such as bones. Only a small percentage, about 10%, of the energy in the grass ends up in the meat. So a lot more of the energy in the wheat reaches people than the energy in the grass would. This means that more people can be fed from the same area of land if it is used for wheat.
Mark scheme
- Wheat is eaten directly, so the chain is shorter — 1 mark
- With cattle there is an extra trophic level (an extra energy transfer) — 1 mark
- Energy is lost at each transfer — 1 mark
- A named way energy is lost by the cattle, such as respiration (heat), waste or uneaten parts — 1 mark
- Only a small percentage (about 10%) of the energy reaches the next level — 1 mark
- So more energy is available to people from the wheat, so the field feeds more people — 1 mark
Quick check
-
1
At which trophic level are the primary consumers?
Show answerHide answer
B: Trophic level 2
Producers are at level 1, primary consumers at level 2, secondary consumers at level 3 and tertiary consumers at level 4.
-
2
Which is the main way in which energy is lost between trophic levels?
Show answerHide answer
C: Heat from respiration
Respiration releases most of the energy in food as heat, which transfers to the surroundings.
-
3
Why are food chains rarely longer than five trophic levels?
Show answerHide answer
A: Too little energy is left to support another level
Energy is lost at each level, so there is too little left to support another population.
-
4
What shape does a pyramid of biomass normally have?
Show answerHide answer
D: Widest at the bottom and narrowest at the top
Each trophic level has less biomass than the level below it, so the pyramid has a wide base and a narrow top.
-
5
A producer level contains 8 000 kJ and the primary consumers contain 640 kJ. What is the efficiency of the energy transfer?
Show answerHide answer
B: 8%
The efficiency is 640 divided by 8000, multiplied by 100, which is 8%.
-
6
Why is biomass measured as dry mass?
Show answerHide answer
D: The water content of an organism varies
The water content of organisms varies, so removing it gives a fairer measure of the living material.
-
7
In a pyramid of biomass, the secondary consumers contain 12 g per m\(^2\) and the primary consumers contain 150 g per m\(^2\). What percentage of the biomass is transferred between them?
Show answerHide answer
A: 8%
The higher level is divided by the lower level: 12 divided by 150 is 0.08, which is 8%.
-
8
Why can a field of wheat feed more people than the same field used for beef cattle?
Show answerHide answer
C: Fewer energy transfers means less energy is lost
Eating the wheat directly is a shorter food chain, so less energy is lost than when it passes through cattle first.