Flashcards · Biology · Ecosystems and Communities
Fieldwork: Quadrats and Transects
-
What is a quadrat?
A square frame that marks out a known area to sample.
-
Why do ecologists sample instead of counting everything?
Counting every organism would take too long and damage the habitat.
-
How do you place a quadrat at random?
Use random numbers as coordinates along two tape measures laid at right angles.
-
Why use random sampling?
To avoid bias, so every part of the area has the same chance of being sampled.
-
Why use many quadrats?
A larger sample is more representative, so the results are more reliable.
-
When do you use a belt transect?
When conditions change gradually across a habitat, such as from shade to light.
-
How are quadrats placed along a belt transect?
At regular intervals along a line, such as every 5 m.
-
Name two ways to measure an abiotic factor along a transect.
A light meter for light intensity, and a moisture meter for soil moisture.
-
What is percentage cover?
The percentage of the quadrat that a species covers.
-
How do you calculate a mean?
The total divided by the number of values.
-
How do you estimate the number of organisms in a field?
Mean per quadrat multiplied by the field area divided by the quadrat area.
-
A 0.5 m by 0.5 m quadrat is placed in a 100 m\(^2\) field. How many quadrats fit in the field?
\(100 \div 0.25 = 400\).
-
Why is the population you work out only an estimate?
It is based on a sample, not on counting every organism.
-
Name one source of error in quadrat work.
Any of: too few quadrats, bias in placing them, misidentifying species, or uncontrolled variables.
-
How can you make quadrat results more reliable?
Use more quadrats, repeat the transect, and control the variables.
-
What does a positive correlation look like on a scatter graph?
The crosses rise from the lower left to the upper right.
-
Does a correlation prove that one variable causes the other?
No, other factors may be involved.
-
What is the benefit of a quadrat with 100 squares?
Each square is 1% of the area, so percentage cover is easy to count.
-
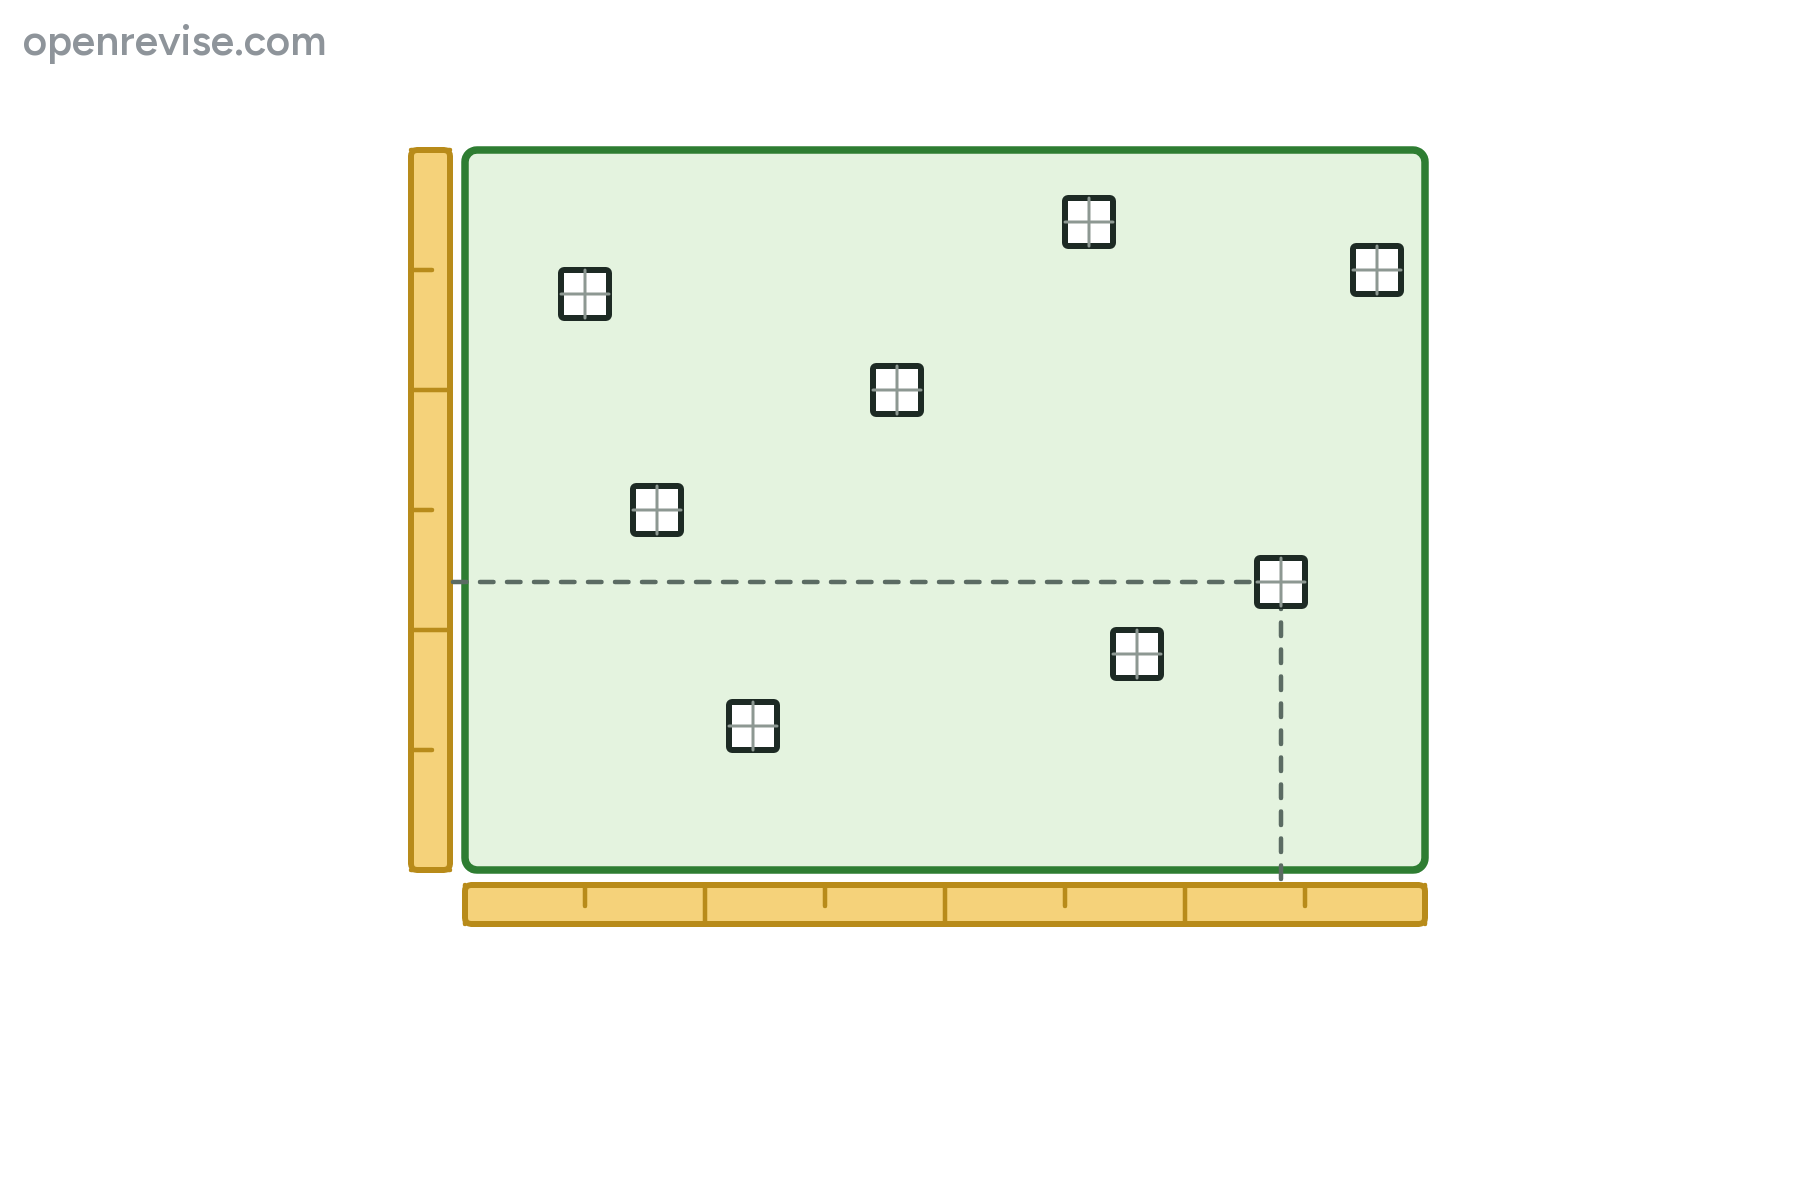 Describe how to place quadrats at random in a study area.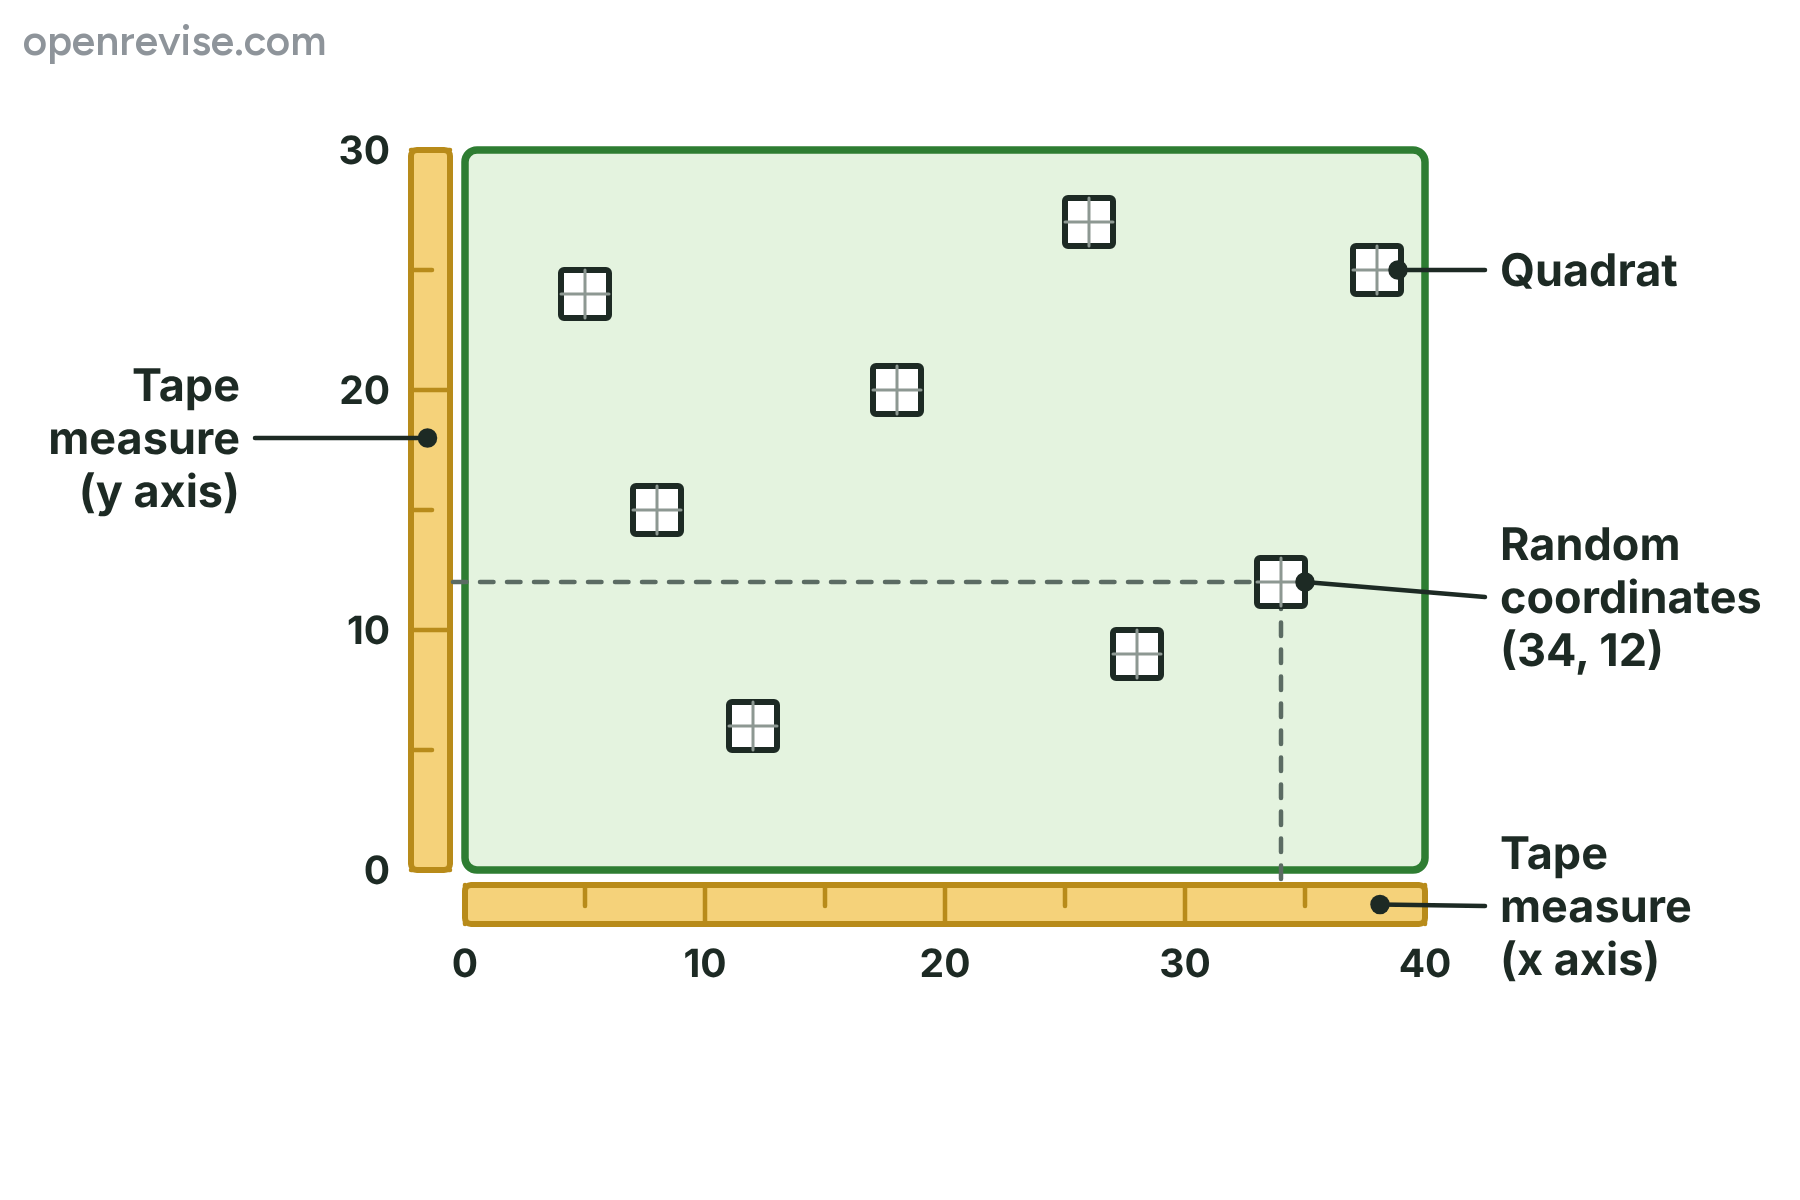
Lay a tape measure along each of two sides at right angles. Use random numbers as coordinates along each tape, place a quadrat where they meet, and record what is in it. Repeat for many quadrats.
-
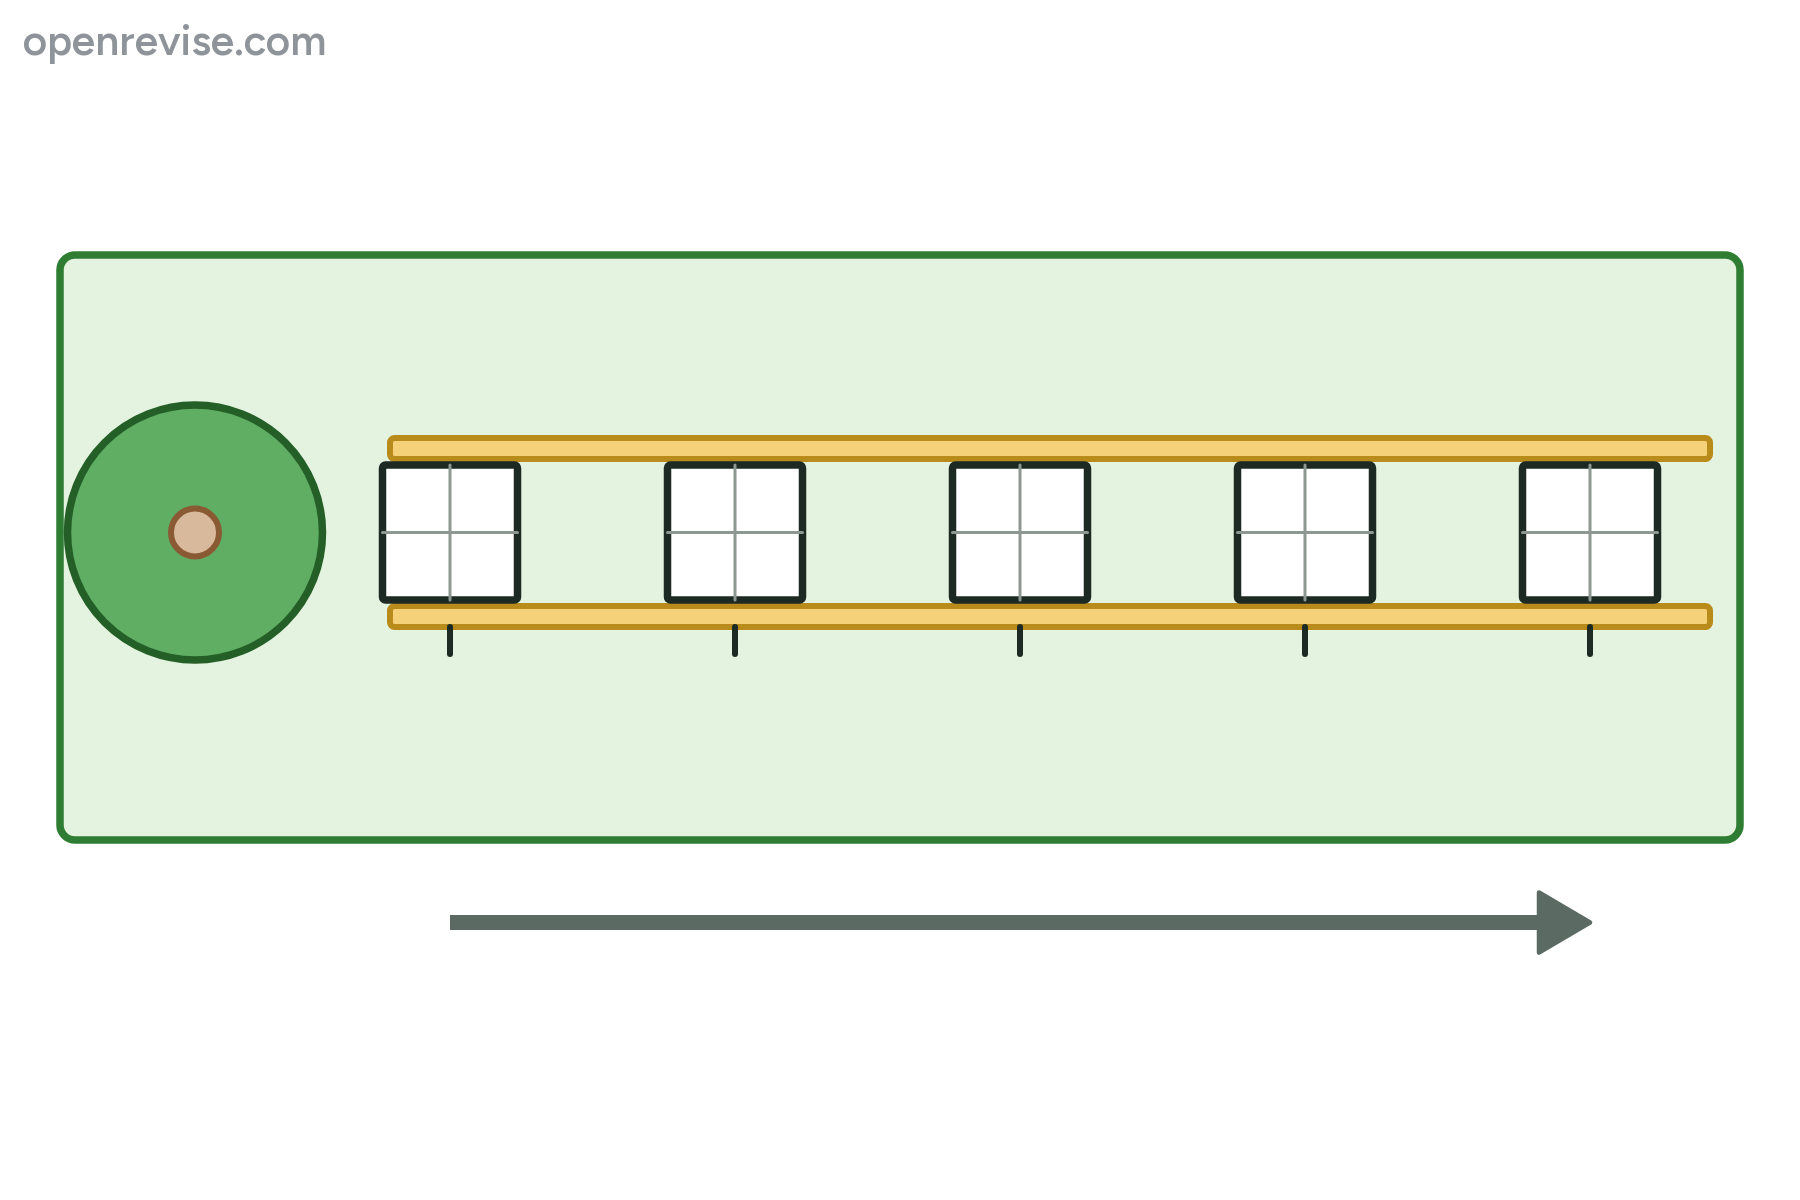 Describe what this belt transect shows, and why it is used.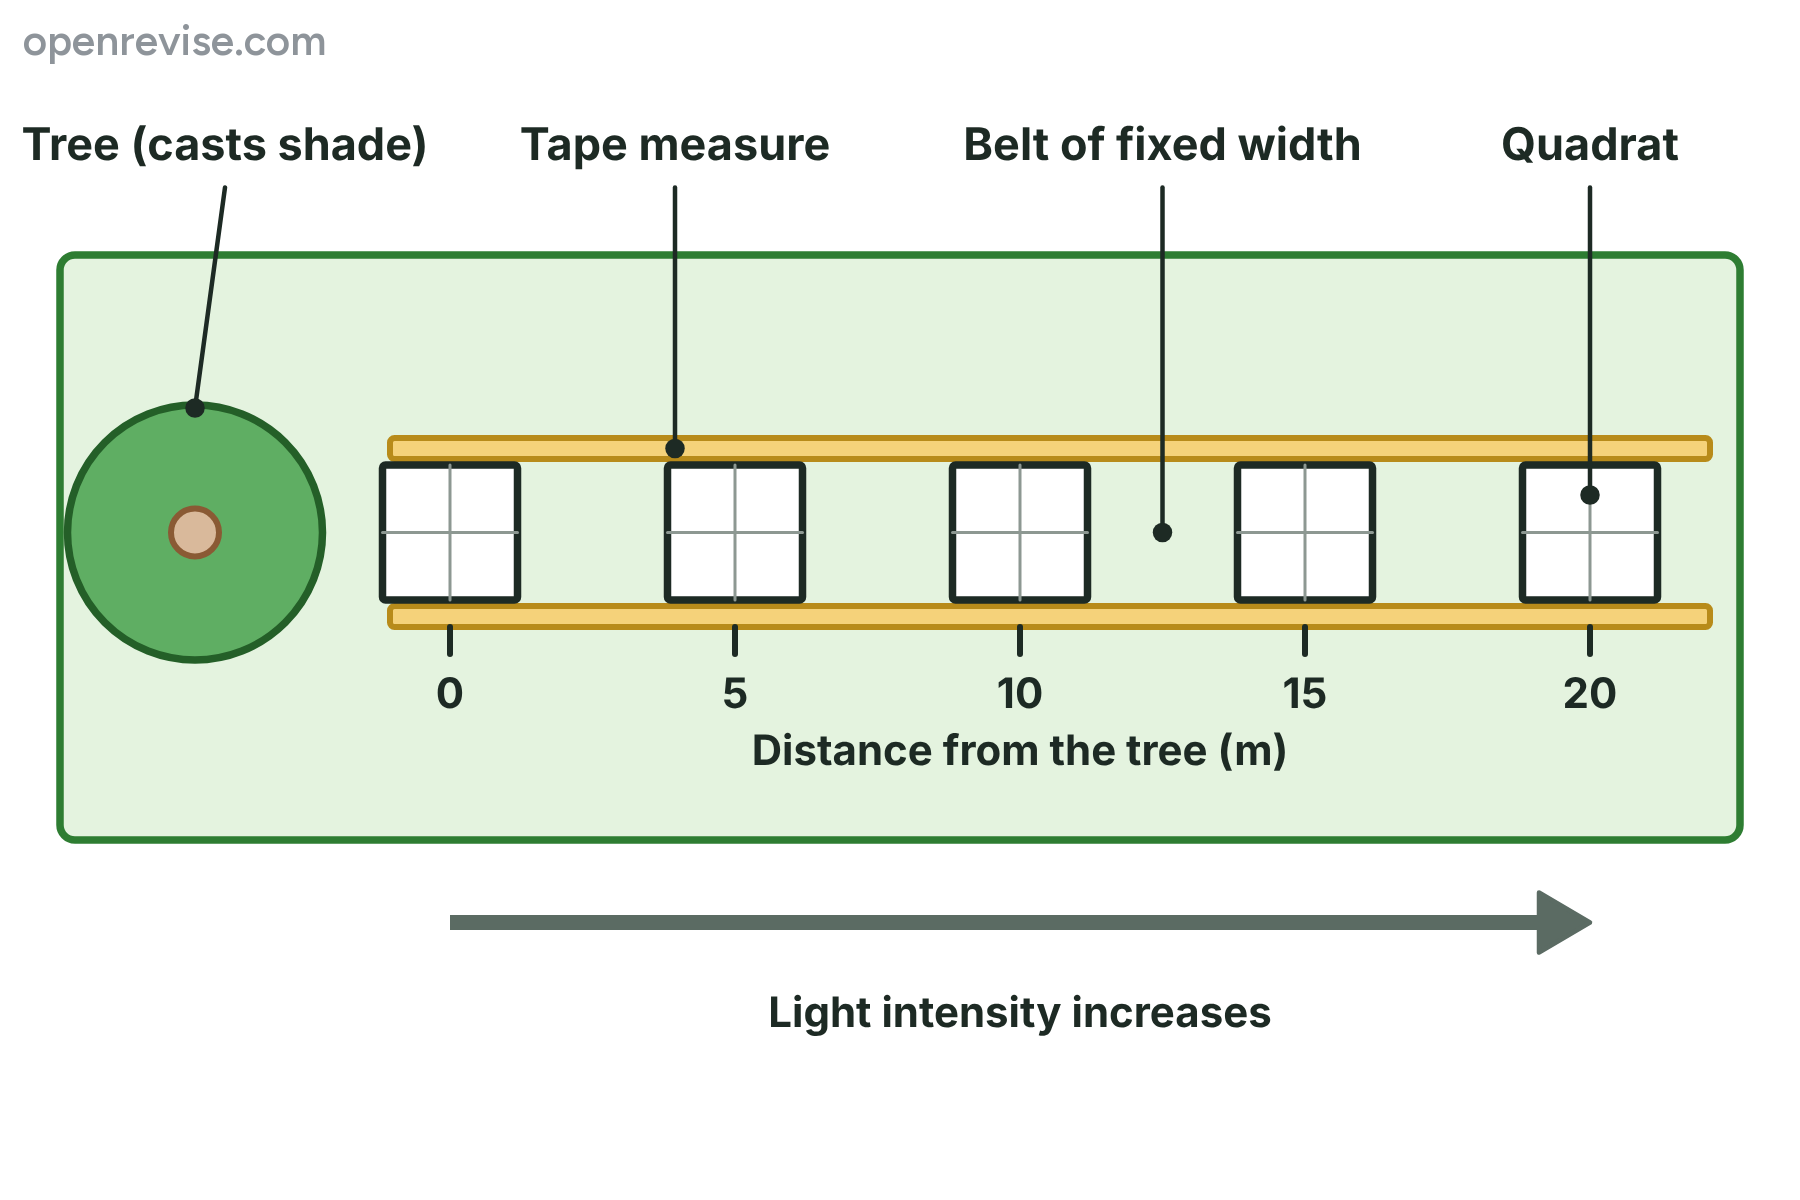
Quadrats are placed at regular intervals along a line running away from the tree. It shows how the organisms change as the light intensity increases from the shade into the open, so each quadrat can be linked to an abiotic factor.