Exam questions · Biology
Monitoring and Maintaining the Environment
- 24 exam questions
- 73 marks
- 24 quick checks
Sampling Organisms: Quadrats and Transects
Just this lesson-
1 Describe [2 marks]
Describe the difference between the abundance and the distribution of a species.
Show answerHide answer
Model answer
Abundance is the number of individuals of the species in an area. Distribution is where in the habitat the species is found.
Mark scheme
- Abundance is the number of individuals in an area — 1 mark
- Distribution is where the species is found — 1 mark
-
2 State [1 mark]
State the name of a piece of equipment that is used to collect small insects from plants without harming them.
Show answerHide answer
Model answer
A pooter.
Mark scheme
- A pooter — 1 mark
-
3 Describe [4 marks]
Describe how you would use quadrats to estimate the abundance of buttercups in a field.
Show answerHide answer
Model answer
Lay two tape measures at right angles to make a grid over the field. Use a random number generator to pick pairs of coordinates, and place a quadrat at each position. Count the buttercups in each quadrat. Repeat for at least ten quadrats and calculate the mean number of buttercups per quadrat.
Mark scheme
- Two tape measures to make a grid — 1 mark
- Random numbers used for the coordinates — 1 mark
- A quadrat placed at each position and the buttercups counted — 1 mark
- At least ten quadrats and the mean calculated — 1 mark
-
4 Calculate [2 marks]
A student counted the number of dandelions in six quadrats. The counts were 3, 0, 5, 2, 4 and 6. Calculate the mean number of dandelions per quadrat.
Show answerHide answer
Model answer
\(3 + 0 + 5 + 2 + 4 + 6 = 20\), and \(20 \div 6 = 3.3\) dandelions per quadrat to one decimal place.
Mark scheme
- \(20 \div 6\) — 1 mark
- 3.3 (3.33 accepted) — 1 mark
-
5 Explain [2 marks]
A student placed her quadrats in the places where there were the most plants. Explain why this is a poor method.
Show answerHide answer
Model answer
She has chosen the places, so the sample is biased. The quadrats are not representative of the whole area, so the abundance will be overestimated.
Mark scheme
- The sample is biased because she chose the places — 1 mark
- It is not representative, so the abundance is overestimated — 1 mark
-
6 Describe [3 marks]
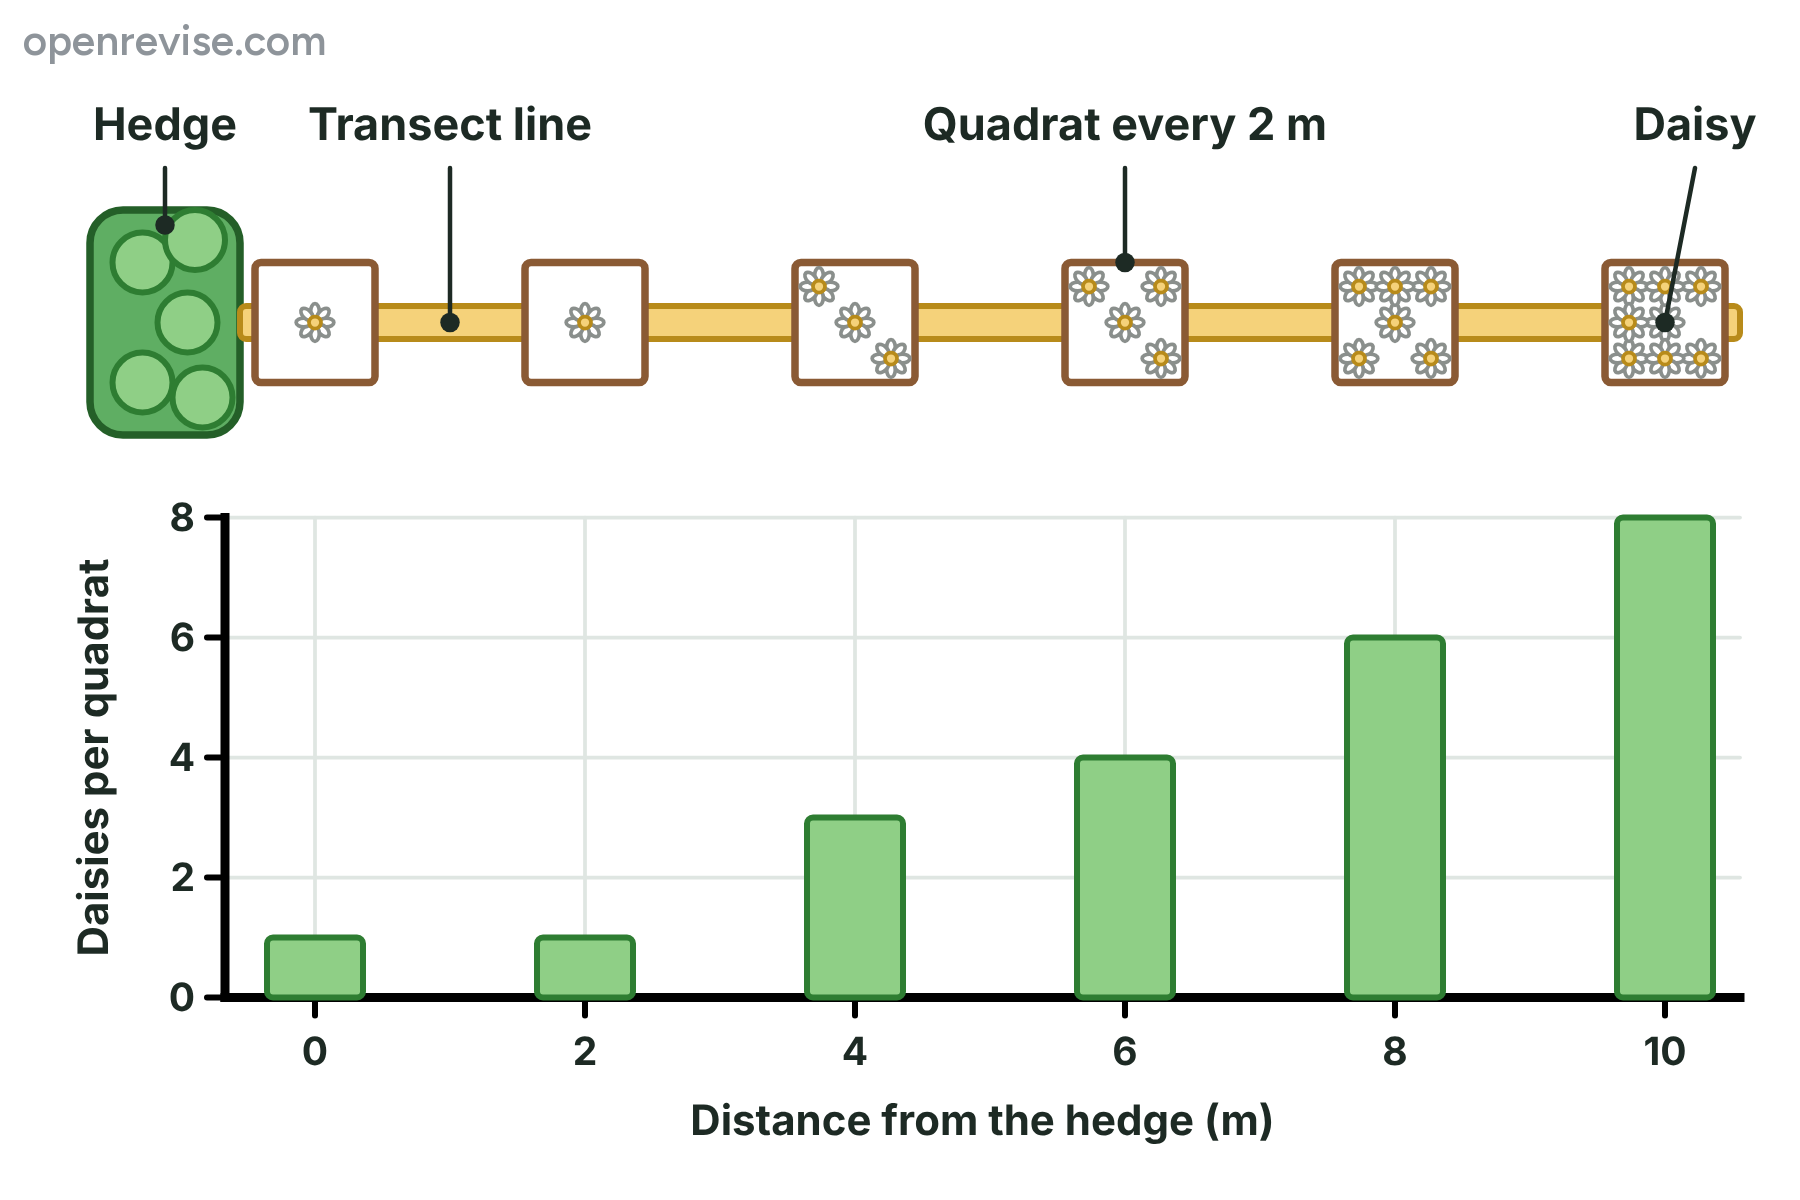
The diagram shows a belt transect from a hedge into a field. Describe the pattern shown by the results and suggest one reason for it.
Show answerHide answer
Model answer
The number of daisies per quadrat increases with distance from the hedge, from 1 at 0 m to 8 at 10 m. This may be because there is more light away from the hedge, as the hedge makes shade, or because the hedge takes water from the soil.
Mark scheme
- Number of daisies increases with distance from the hedge — 1 mark
- Uses data, such as 1 at 0 m and 8 at 10 m — 1 mark
- A suitable reason, such as less shade or more water — 1 mark
-
7 Explain [3 marks]
Explain why a student should use at least ten quadrats, rather than two, to estimate the abundance of a plant.
Show answerHide answer
Model answer
A small number of quadrats may be unusual by chance, for example by landing on a bare patch or a very crowded patch. With more quadrats, the unusual values have less effect on the mean. So the mean is more likely to be representative of the whole area, and the result is more reliable.
Mark scheme
- A few quadrats may be unusual by chance — 1 mark
- More quadrats reduce the effect of unusual results on the mean — 1 mark
- The mean is more representative of the area, so it is more reliable — 1 mark
-
8 Describe [6 marks]
A student thinks that the number of moss plants is greater in shaded parts of a lawn than in sunny parts. Describe how the student could investigate this. Include the equipment and how the results would be made reliable.
Show answerHide answer
Model answer
The student should choose a shaded area, for example under a tree, and a sunny area of lawn. In each area, tape measures are laid at right angles and random numbers are used for the coordinates of at least ten quadrats. A quadrat of the same size is used in both areas. Moss cannot be counted as separate plants, so the student estimates the percentage cover in each quadrat, using the grid of squares. A light meter is used at each quadrat to show that the light level is different. The mean percentage cover is calculated for each area and compared. To make the results reliable the quadrats are used in the same way, the work is done at the same time and the same person counts, and the investigation could be repeated on other lawns. The student should take care not to damage the plants.
Mark scheme
- Chooses a shaded area and a sunny area — 1 mark
- Random coordinates from a grid made with tape measures — 1 mark
- At least ten quadrats of the same size in each area — 1 mark
- Percentage cover estimated for moss — 1 mark
- Measures light intensity with a light meter — 1 mark
- Calculates and compares the means, with repeats or controlled variables — 1 mark
Quick check
-
1
What does the abundance of a species mean?
Show answerHide answer
B: The number of individuals in an area
Abundance is the number of individuals of a species in an area. Where they are found is the distribution.
-
2
Why are quadrats placed at random positions?
Show answerHide answer
D: To avoid bias
Random positions give every part of the area an equal chance, which avoids bias in the sample.
-
3
Which method is best for finding how the distribution of a species changes from the edge of a wood into a field?
Show answerHide answer
A: A transect
A transect samples at regular intervals along a line, so it shows how organisms change along an environmental gradient.
-
4
What is a pooter used for?
Show answerHide answer
C: Collecting small insects from plants
A pooter sucks small insects into a jar through a tube, without harming them.
-
5
A quadrat has 25 equal squares, and a plant covers 6 of them. What is its percentage cover?
Show answerHide answer
C: 24 per cent
Each square is 4 per cent, so 6 squares is 24 per cent (6 divided by 25, times 100).
-
6
Five quadrats contain 2, 4, 6, 6 and 7 plants. What is the mean number of plants per quadrat?
Show answerHide answer
B: 5.0
The total is 25, and 25 divided by 5 is 5 plants per quadrat.
-
7
Which of these makes a field investigation more reliable?
Show answerHide answer
D: Using a large number of quadrats
More quadrats reduce the effect of unusual results, so the mean is more reliable.
-
8
What is an identification key?
Show answerHide answer
A: A set of paired statements that leads to the name of an organism
A key is a series of paired statements about features, which leads to the name of an organism.
Estimating Population Size
Just this lesson-
1 State [2 marks]
State the equation used to estimate population size in the capture-recapture method.
Show answerHide answer
Model answer
Population size = (number in first sample × number in second sample) ÷ number of marked animals in the second sample.
Mark scheme
- Number in first sample × number in second sample — 1 mark
- Divided by the number of marked animals in the second sample — 1 mark
-
2 Calculate [3 marks]
A student placed 0.25 m\(^2\) quadrats at random in a field of area 1200 m\(^2\). The numbers of buttercups in the quadrats were 8, 12, 10, 6, 9, 11, 7, 10, 9 and 8. Estimate the number of buttercups in the field.
Show answerHide answer
Model answer
The total is 90, so the mean is \(90 \div 10 = 9.0\) per quadrat. The number of quadrats that fit in the field is \(1200 \div 0.25 = 4800\). The estimate is \(9.0 \times 4800 = 43\,200\) buttercups.
Mark scheme
- Mean = 9.0 per quadrat — 1 mark
- \(1200 \div 0.25 = 4800\) quadrats — 1 mark
- \(9.0 \times 4800 = 43\,200\) — 1 mark
-
3 Calculate [3 marks]
A scientist caught 60 frogs in a pond, marked them and released them. A week later she caught 45 frogs, and 15 of them were marked. Calculate an estimate of the number of frogs in the pond.
Show answerHide answer
Model answer
\(\frac{60 \times 45}{15} = \frac{2700}{15} = 180\) frogs.
Mark scheme
- \(60 \times 45\) — 1 mark
- Divided by 15 — 1 mark
- 180 frogs — 1 mark
-
4 Describe [4 marks]
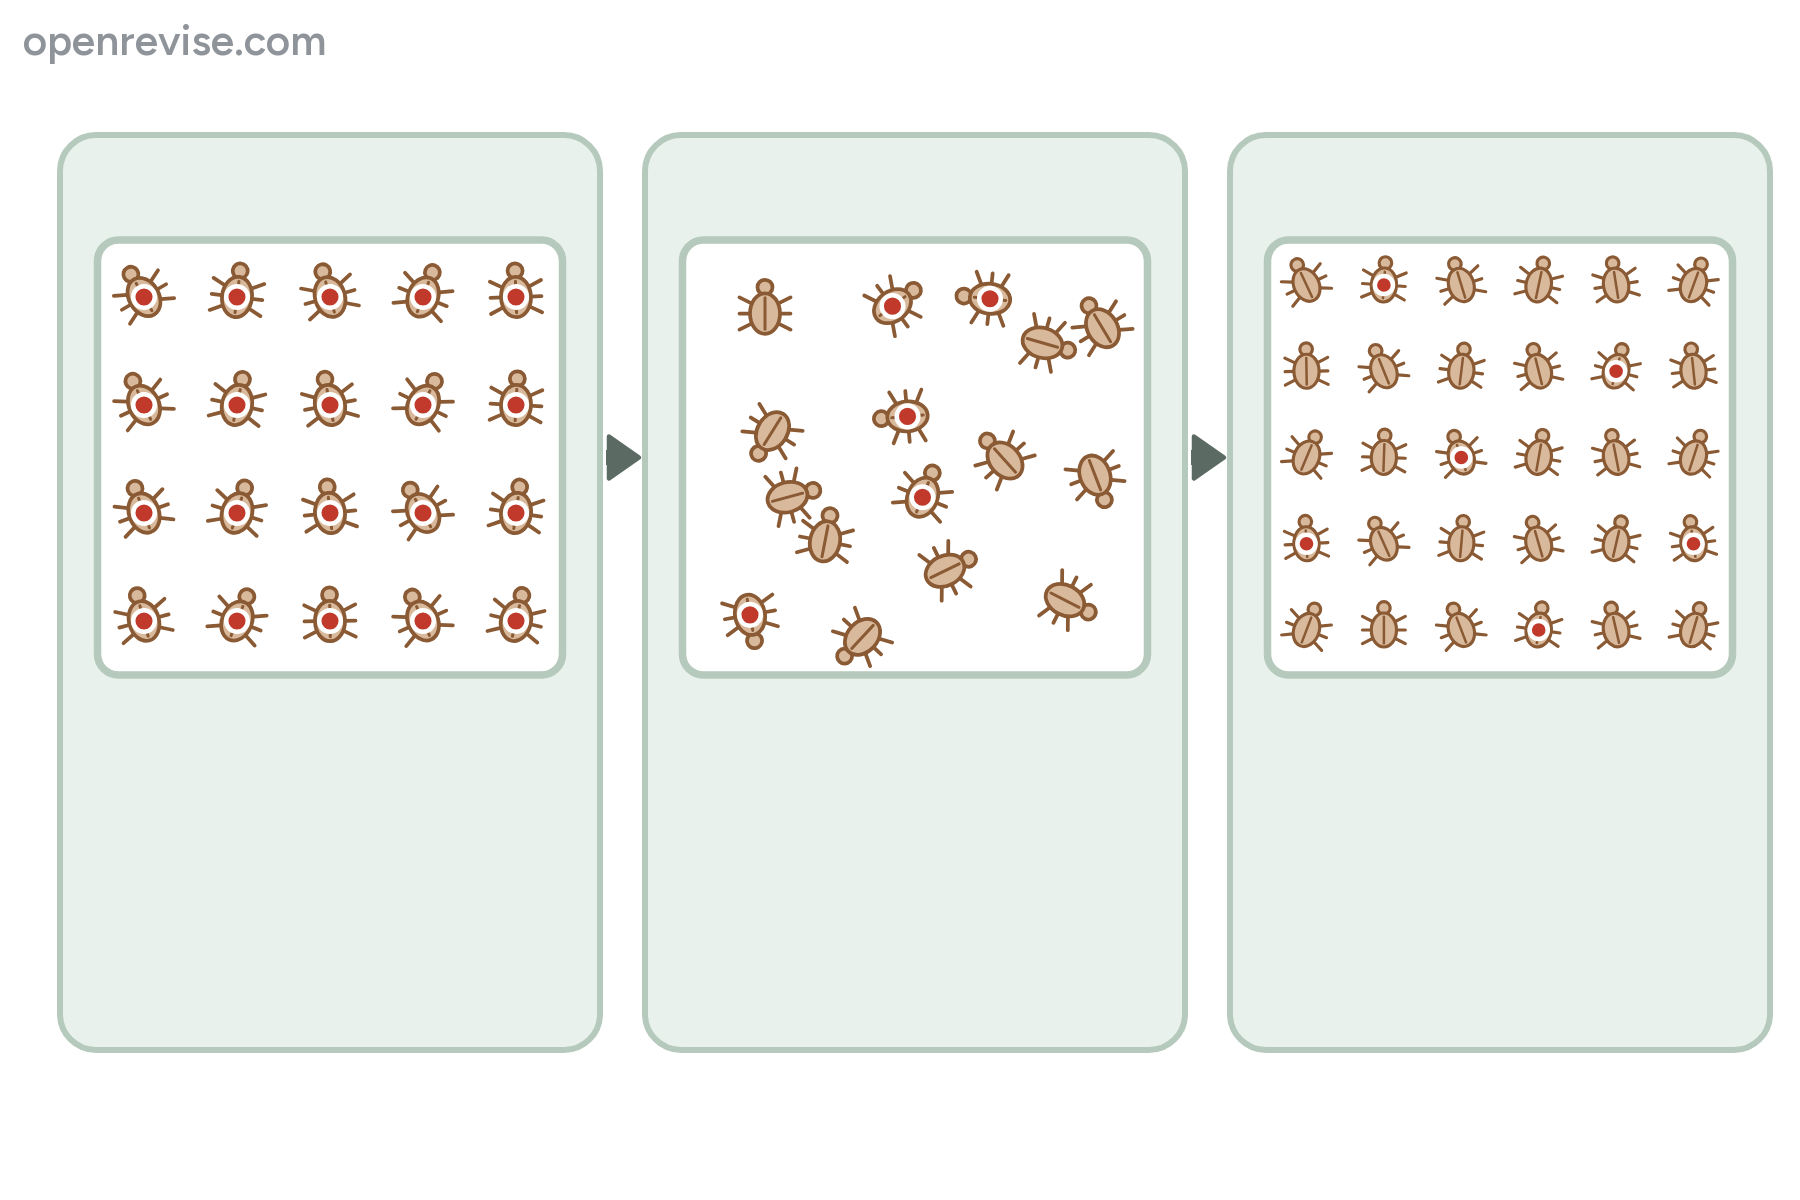
The diagram shows three stages in an investigation to estimate the size of a population of beetles. Describe what is done at each stage and how the result is used.
Show answerHide answer
Model answer
In stage 1 a sample of beetles is caught, counted, marked with a harmless spot and released. In stage 2 time is left for the marked beetles to mix with the rest of the population. In stage 3 a second sample is caught and the beetles are counted, with the number that are marked. The population is calculated as the number in the first sample times the number in the second sample divided by the number marked in the second sample.
Mark scheme
- Stage 1: caught, counted, marked and released — 1 mark
- Stage 2: time for the beetles to mix — 1 mark
- Stage 3: second sample caught, with the total and the number marked counted — 1 mark
- Population = first sample × second sample ÷ number marked — 1 mark
-
5 Explain [3 marks]
Explain two assumptions that are made when using the capture-recapture method.
Show answerHide answer
Model answer
The population does not change between the two samples, because no animals are born, die or move in or out. If they did, the fraction of marked animals would not show the population size. The marked animals mix evenly with the rest, so the second sample is representative. The marks do not harm the animals or come off.
Mark scheme
- First assumption stated, such as no births, deaths or movement — 1 mark
- Second assumption stated, such as mixing or marks not lost — 1 mark
- A reason why one of the assumptions is needed — 1 mark
-
6 Explain [3 marks]
During a capture-recapture investigation, the paint on some of the marked snails washed off in the rain. Explain how this would affect the estimated population.
Show answerHide answer
Model answer
Fewer of the marked snails would be recognised in the second sample, so the value for the number marked in the second sample would be too small. The population is calculated by dividing by this number, so the estimate would be too large. The population would be overestimated.
Mark scheme
- Fewer marked snails are found in the second sample — 1 mark
- The number marked is the divisor, so the result is larger — 1 mark
- The population is overestimated — 1 mark
-
7 Evaluate [6 marks]
A student estimated the number of woodlice under a hedge. She caught 12 woodlice, marked them and released them. The next day she caught 10 woodlice, and 2 were marked. She calculated that the population was 60. Evaluate the reliability of her estimate, and suggest how she could improve it.
Show answerHide answer
Model answer
The calculation is \(\frac{12 \times 10}{2} = 60\), which is correct for her figures. However, the samples were small, so one more or one fewer marked woodlouse in the second sample would change the estimate a lot. For example, if there had been 3 marked, the estimate would be 40. The result may also have been affected by errors in the assumptions, such as the marks rubbing off, some woodlice moving away from the hedge or dying, or the marked woodlice not having mixed after only one day. She made only one estimate, so she cannot tell how variable it is. She could improve the estimate by catching more woodlice in each sample, for example by using more traps, waiting until the marked woodlice have mixed, and by checking that the marks do not wash off. She should repeat the investigation several times and calculate a mean.
Mark scheme
- The calculation is correct, 60 — 1 mark
- The samples are small, so one animal changes the estimate a lot — 1 mark
- An assumption that may not be met, such as marks lost or movement — 1 mark
- Only one estimate, so reliability cannot be judged — 1 mark
- An improvement, such as larger samples or more traps — 1 mark
- Repeat the investigation and take the mean — 1 mark
-
8 Calculate [2 marks]
A student estimated that moss covered a mean of 15 per cent of each quadrat on a lawn with an area of 200 m\(^2\). Calculate the area of the lawn that is covered by moss.
Show answerHide answer
Model answer
\(0.15 \times 200 = 30\) m\(^2\).
Mark scheme
- \(\frac{15}{100} \times 200\) — 1 mark
- 30 m\(^2\) — 1 mark
Quick check
-
1
A mean of 6 plants was counted in 0.25 m\(^2\) quadrats. The area of the habitat is 100 m\(^2\). What is the estimated population?
Show answerHide answer
B: 2400
The number of quadrats that fit in the area is 100 divided by 0.25, which is 400, and 400 times 6 is 2400.
-
2
For which of these is capture-recapture the most suitable method?
Show answerHide answer
D: Ground beetles in a field
Capture-recapture is used for animals that move, so they cannot be counted in a quadrat.
-
3
In a capture-recapture investigation, 30 animals were marked, 40 were caught in the second sample and 10 of those were marked. What is the estimated population?
Show answerHide answer
A: 120
The population is 30 times 40 divided by 10, which is 120.
-
4
Why is there a delay between the first and second samples in capture-recapture?
Show answerHide answer
C: So that the marked animals can mix with the rest
The marked animals need time to mix evenly with the rest of the population, so the second sample is representative.
-
5
Which of these is an assumption of the capture-recapture method?
Show answerHide answer
B: No animals are born, die or move in or out
If the population changed, the fraction of marked animals would not show the size of the population.
-
6
What would happen to the estimated population if the marked animals did not mix with the others and stayed near where they were released, where the second sample was caught?
Show answerHide answer
D: It would be underestimated
More marked animals would be in the second sample than expected, so the number marked is too high and the population is underestimated.
-
7
How can the reliability of an estimate of population size from quadrats be improved?
Show answerHide answer
A: Using more quadrats placed at random
More quadrats, placed at random, make the mean less affected by unusual values.
-
8
A quadrat is 0.5 m by 0.5 m. What is its area?
Show answerHide answer
C: 0.25 square metres
Area is length times width, which is 0.5 times 0.5, which is 0.25 square metres.
Human Interactions and Biodiversity
Just this lesson-
1 State [1 mark]
State what is meant by biodiversity.
Show answerHide answer
Model answer
The variety of living organisms in a habitat, or on Earth.
Mark scheme
- The variety of living organisms (species) in an area — 1 mark
-
2 Explain [3 marks]
Explain how deforestation can reduce biodiversity.
Show answerHide answer
Model answer
Deforestation destroys the habitat of the species that live in the forest, so they lose their food and shelter and may die out. Other species that depend on them, for example as food, are also lost because of interdependence. Fewer species are left, so the biodiversity falls.
Mark scheme
- The habitat is destroyed, so organisms lose their food and shelter — 1 mark
- Species die out or move away — 1 mark
- Interdependent species are also lost, so biodiversity falls — 1 mark
-
3 Calculate [2 marks]
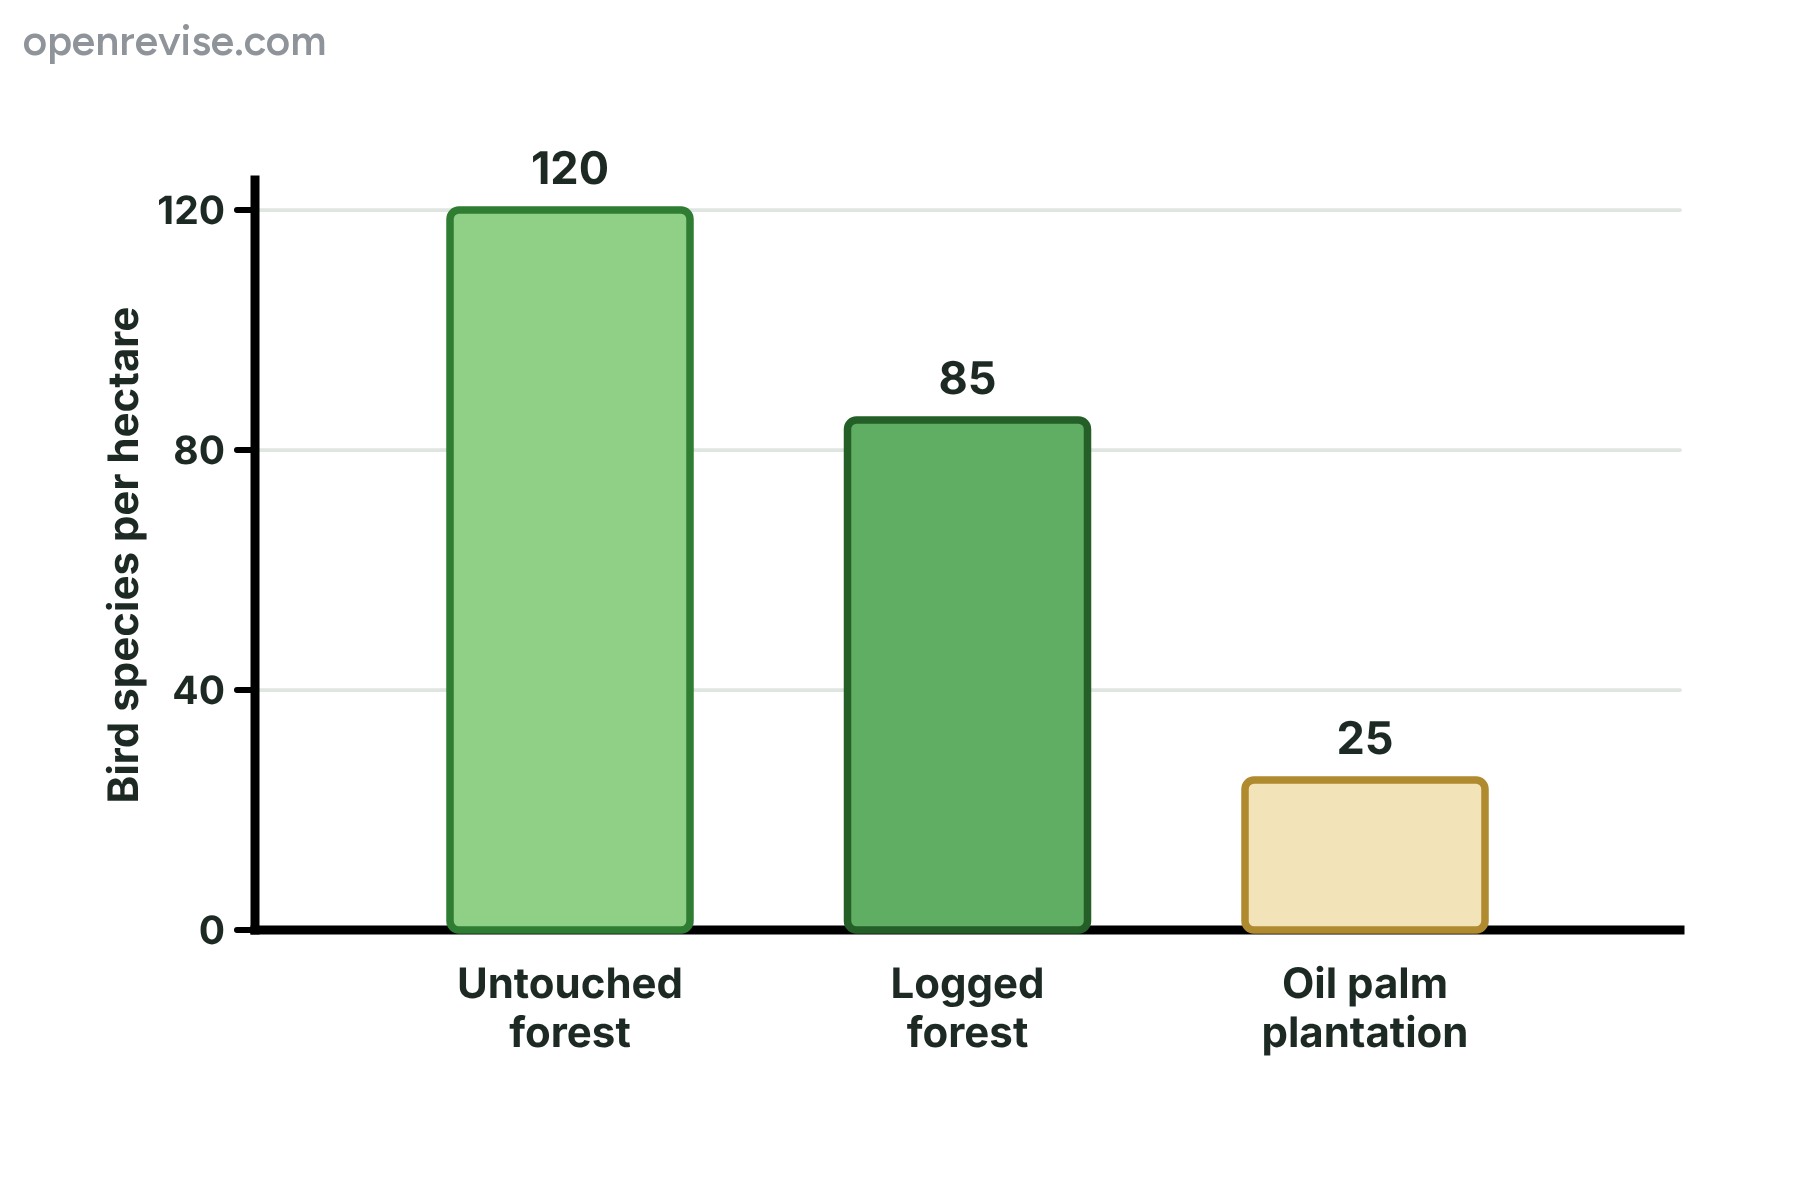
The bar chart shows the number of species of bird in a hectare of three types of land. Calculate the percentage decrease in the number of species between untouched forest and logged forest. Give your answer to the nearest whole number.
Show answerHide answer
Model answer
The decrease is \(120 - 85 = 35\), and \(\frac{35}{120} \times 100 = 29.2\), which is 29 per cent.
Mark scheme
- \(\frac{35}{120} \times 100\) — 1 mark
- 29 per cent — 1 mark
-
4 Describe [4 marks]
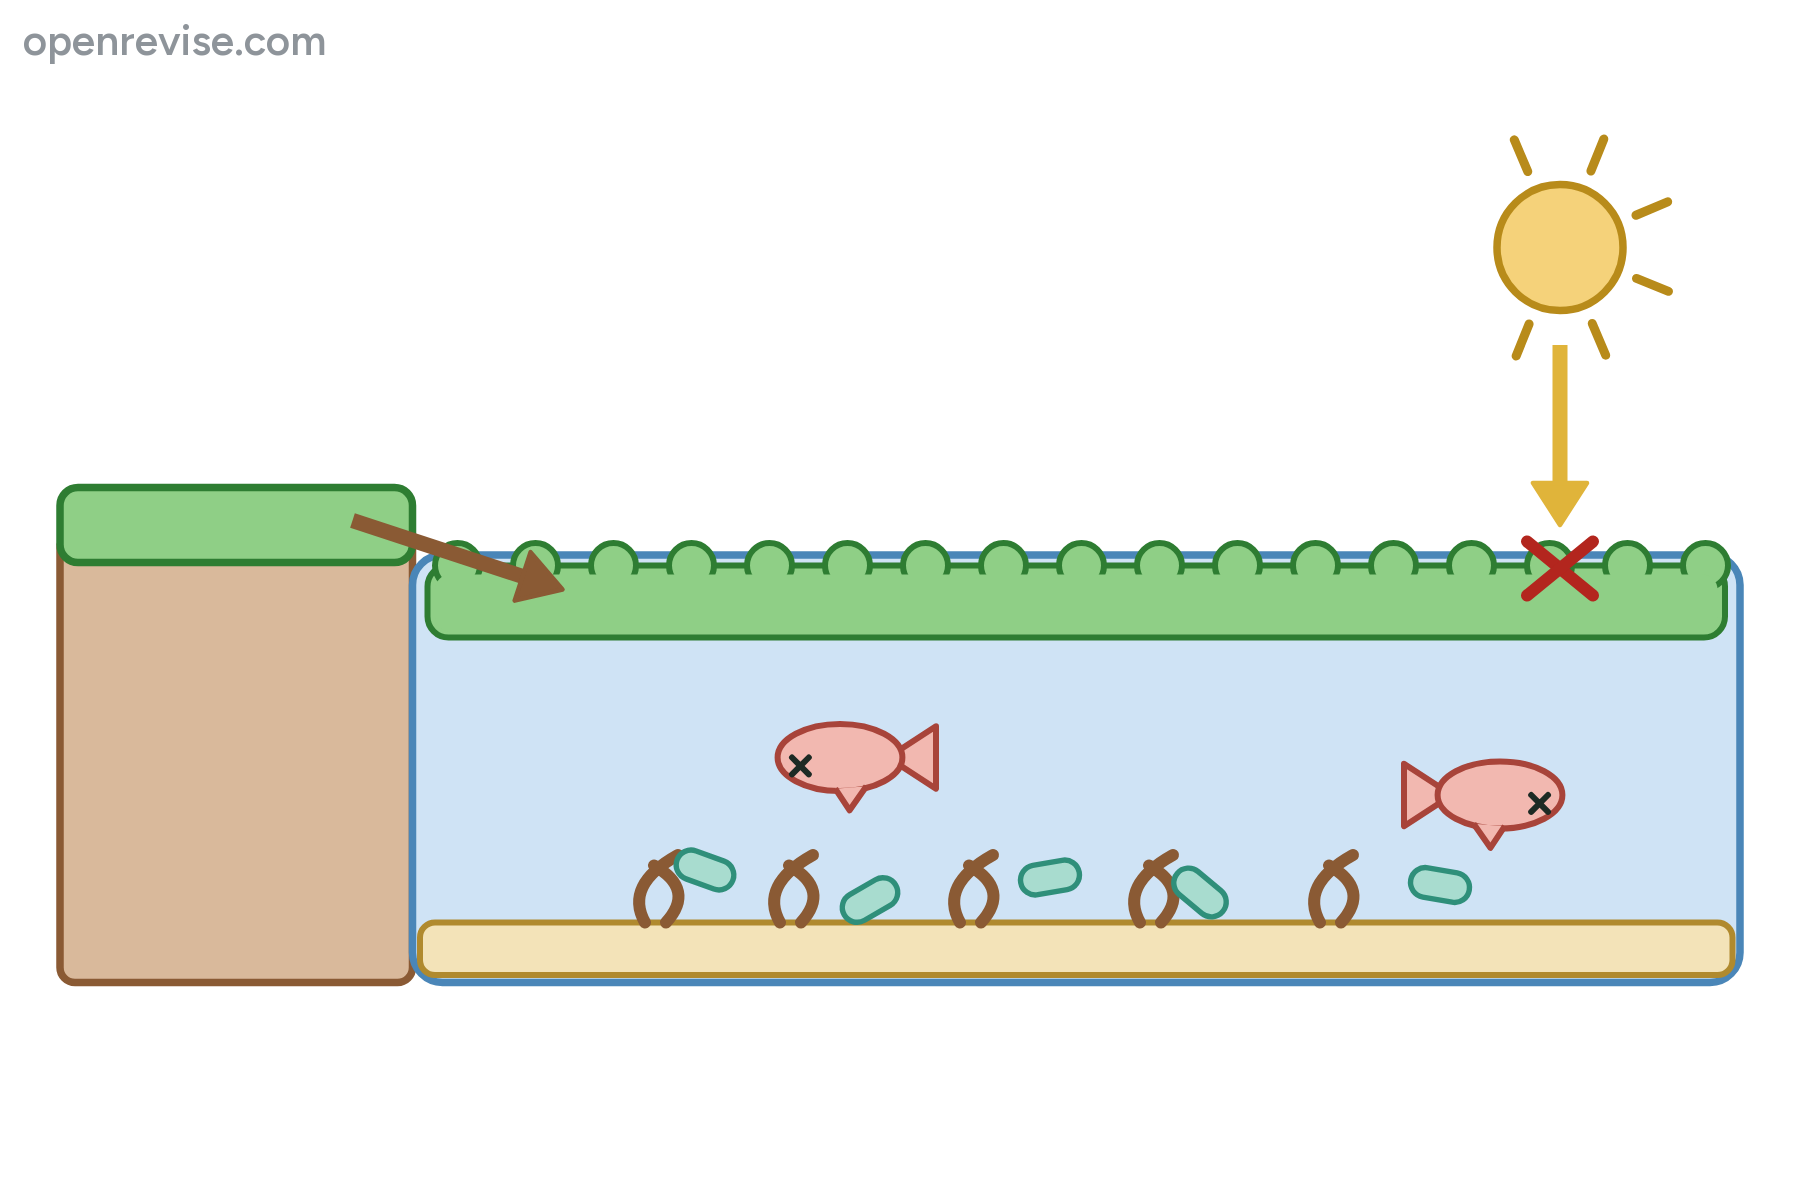
The diagram shows a pond next to a field that has been given a lot of fertiliser. Describe how the fertiliser led to the death of the fish in the pond.
Show answerHide answer
Model answer
Rain washed the fertiliser into the pond, and the nutrients made the algae grow rapidly, to form a layer on the surface. The algae blocked the light, so the plants under the water could not photosynthesise and died. Bacteria decomposed the dead plants and algae, and used up the oxygen in respiration. There was not enough oxygen for the fish, so they died.
Mark scheme
- Fertiliser runs into the pond and the algae grow rapidly — 1 mark
- Algae block the light, so the plants die — 1 mark
- Bacteria decompose the dead material and use up oxygen — 1 mark
- The fish die from a lack of oxygen — 1 mark
-
5 Explain [3 marks]
The grey squirrel was introduced to Britain from North America. The number of red squirrels has fallen since. Explain why.
Show answerHide answer
Model answer
The grey squirrel competes with the red squirrel for food and living space, and it eats the food more efficiently, so there is less for the reds. Grey squirrels also carry a virus, squirrelpox, that kills red squirrels but does not harm greys. So the red squirrels die or breed less and their numbers fall.
Mark scheme
- Competition for food and space — 1 mark
- Grey squirrels carry a disease that kills red squirrels — 1 mark
- Red squirrels die or breed less, so numbers fall — 1 mark
-
6 Describe [2 marks]
Describe two ways in which humans can conserve an endangered species.
Show answerHide answer
Model answer
Any two from: protect its habitat in a nature reserve or national park; breed it in captivity and release the young into the wild; pass laws to stop hunting or the trade in the species; restore habitats and link them with corridors.
Mark scheme
- First method — 1 mark
- Second method — 1 mark
-
7 Explain [3 marks]
The passenger pigeon was once one of the commonest birds in North America, but became extinct in 1914. Explain how hunting can cause a species to become extinct.
Show answerHide answer
Model answer
If animals are hunted faster than they can breed, the population falls. When the population is small, there are few individuals to breed, and there is little genetic variation, so it cannot recover. The last individuals are killed, so the species is extinct.
Mark scheme
- Hunted faster than they can breed, so the population falls — 1 mark
- A small population finds it hard to breed or has little variation — 1 mark
- Last individuals die, so the species is extinct — 1 mark
-
8 Discuss [6 marks]
Humans can have both positive and negative effects on biodiversity. Discuss, using examples.
Show answerHide answer
Model answer
Humans have reduced biodiversity in many ways. Clearing forests for farmland destroys the habitat of thousands of species, and a plantation of one crop has far fewer species than the forest that it replaced. Hunting and overfishing have driven species such as the passenger pigeon to extinction, and pollution, such as fertiliser running into ponds, leads to eutrophication and the death of fish. Introduced species such as the grey squirrel have out-competed native species. However, humans can also protect biodiversity. Nature reserves protect habitats from building, captive breeding and reintroduction brought back the red kite and the Arabian oryx, and laws, such as the ban on trade in endangered species, reduce hunting. Sustainable use of forests and fish stocks keeps the resource for the future. Because species are interdependent, protecting a habitat protects many species at once. Overall the damage has so far been much greater than the repair, but the successes show that conservation works when there is the political will and enough money.
Mark scheme
- A negative interaction explained, such as deforestation destroying habitats — 1 mark
- A second negative interaction with an example — 1 mark
- A third, such as pollution or an introduced species — 1 mark
- A positive interaction explained, such as a reserve or captive breeding — 1 mark
- A named example, such as the red kite — 1 mark
- A reasoned judgement or conclusion about the balance — 1 mark
Quick check
-
1
What is deforestation?
Show answerHide answer
C: The clearing of large areas of forest
Deforestation is the clearing of large areas of forest, usually for timber, farming or building.
-
2
Which of these is an example of a negative human interaction with an ecosystem?
Show answerHide answer
B: Draining a wetland to build houses
Draining a wetland destroys the habitat of the species that live there. The others are positive interactions.
-
3
What is the first effect of fertiliser running into a pond?
Show answerHide answer
A: Algae grow rapidly
The extra nutrients make the algae grow very quickly, which is an algal bloom. The loss of oxygen comes later.
-
4
Why do fish die in a pond with an algal bloom?
Show answerHide answer
D: The oxygen is used up by decomposers
Bacteria decomposing the dead plants and algae use up the oxygen, so the fish cannot get enough.
-
5
What is an introduced species?
Show answerHide answer
B: A species brought by humans to a new place
An introduced species has been brought by humans to a place where it did not live before.
-
6
Which is an example of conservation by captive breeding?
Show answerHide answer
C: Breeding Arabian oryx in a zoo and releasing them
Captive breeding is the breeding of rare animals in zoos or reserves, to release them into the wild.
-
7
Why does the loss of one species often affect others?
Show answerHide answer
A: Species depend on each other
Species are interdependent, for example one may be the food or shelter of another.
-
8
An area of forest had 80 species before it was logged, and 60 species afterwards. What is the percentage decrease?
Show answerHide answer
D: 25 per cent
The decrease is 20 species, and 20 divided by 80, times 100, is 25 per cent.