Biology · Health, Disease and Cancer
Health and Disease
Health is more than not being ill, and diseases rarely act alone. This lesson separates communicable from non-communicable disease, shows how different diseases interact and introduces the data skills used to study them.
Learning Objectives
- 1Define health and describe the difference between communicable and non-communicable diseases.
- 2Describe four ways in which different types of disease interact.
- 3Translate disease data between tables, charts and graphs.
- 4Use a scatter diagram to identify a correlation, and explain why sampling matters.
Retrieval practice
-
1
What is a pathogen?
Show answerHide answer
A microorganism that causes disease.
-
2
What is coronary heart disease?
Show answerHide answer
A disease in which fatty deposits narrow the coronary arteries.
-
3
Name two types of pathogen.
Show answerHide answer
Any two of viruses, bacteria, fungi and protists.
-
4
What do white blood cells do?
Show answerHide answer
Defend the body against pathogens.
What is health?
Health is the state of physical and mental well-being. Someone who has no infection but is under severe stress or is very depressed is not completely healthy. Diseases are major causes of ill health, but they are not the only ones: diet, stress and life situations can all have a profound effect on both physical and mental health.
Two kinds of disease
Diseases fall into two groups, depending on whether they can be passed from one person to another.
-
Communicable diseases
Also called infectious diseases. They are caused by pathogens such as viruses, bacteria, fungi and protists and can spread from person to person, or from animals and plants to people.
-
Non-communicable diseases
They are not caused by a pathogen and cannot be passed on. Examples are coronary heart disease, type 2 diabetes, cancers and many lung diseases.
How different diseases interact
The different types of disease often affect each other.
-
Immune system defects
If the immune system is damaged, for example by HIV, a person is more likely to suffer infectious diseases.
-
Viruses and cancer
Some viruses that live inside cells can trigger cancers. For example, the human papillomavirus (HPV) can lead to cervical cancer.
-
Allergies
An immune reaction first set off by a pathogen can trigger allergies, such as skin rashes and asthma.
-
Physical and mental health
Severe physical ill health can lead to depression and other mental illness.
How diseases interact
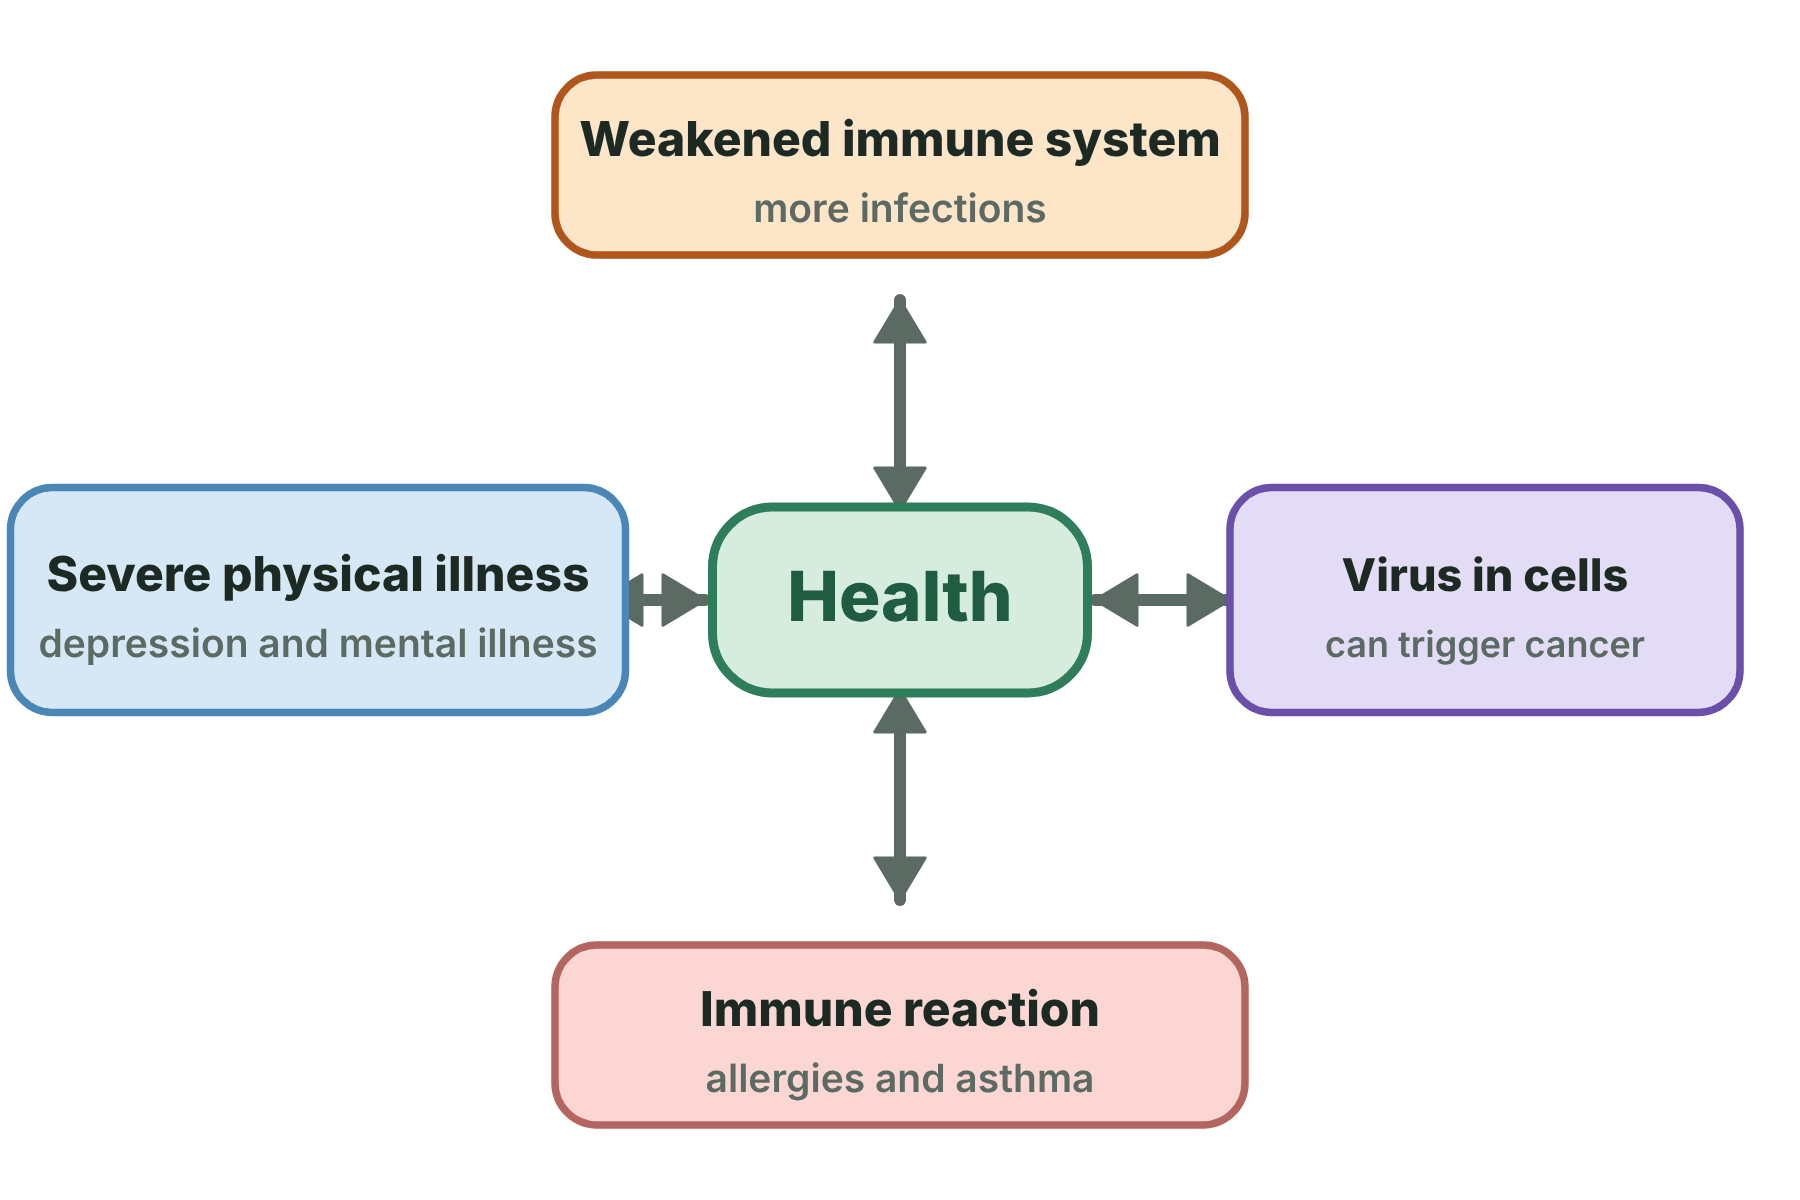
Different types of disease can make each other more likely.
Using data about disease
Epidemiology is the study of how often diseases occur and why. The same information can be shown in different ways, and you must be able to move between them.
-
Tables and frequency tables
Give the exact numbers. A frequency table counts how many cases fall in each group.
-
Bar charts and histograms
Show the groups as bars. A bar chart is for separate categories, and a histogram is for continuous data such as age ranges.
-
Scatter diagrams
Plot two variables against each other to see whether there is a correlation, which is a pattern linking them.
-
Sampling
Data about a disease are collected from a sample of people, not everyone. A bigger sample that fairly represents the whole population gives more reliable results.
Correlation on a scatter diagram
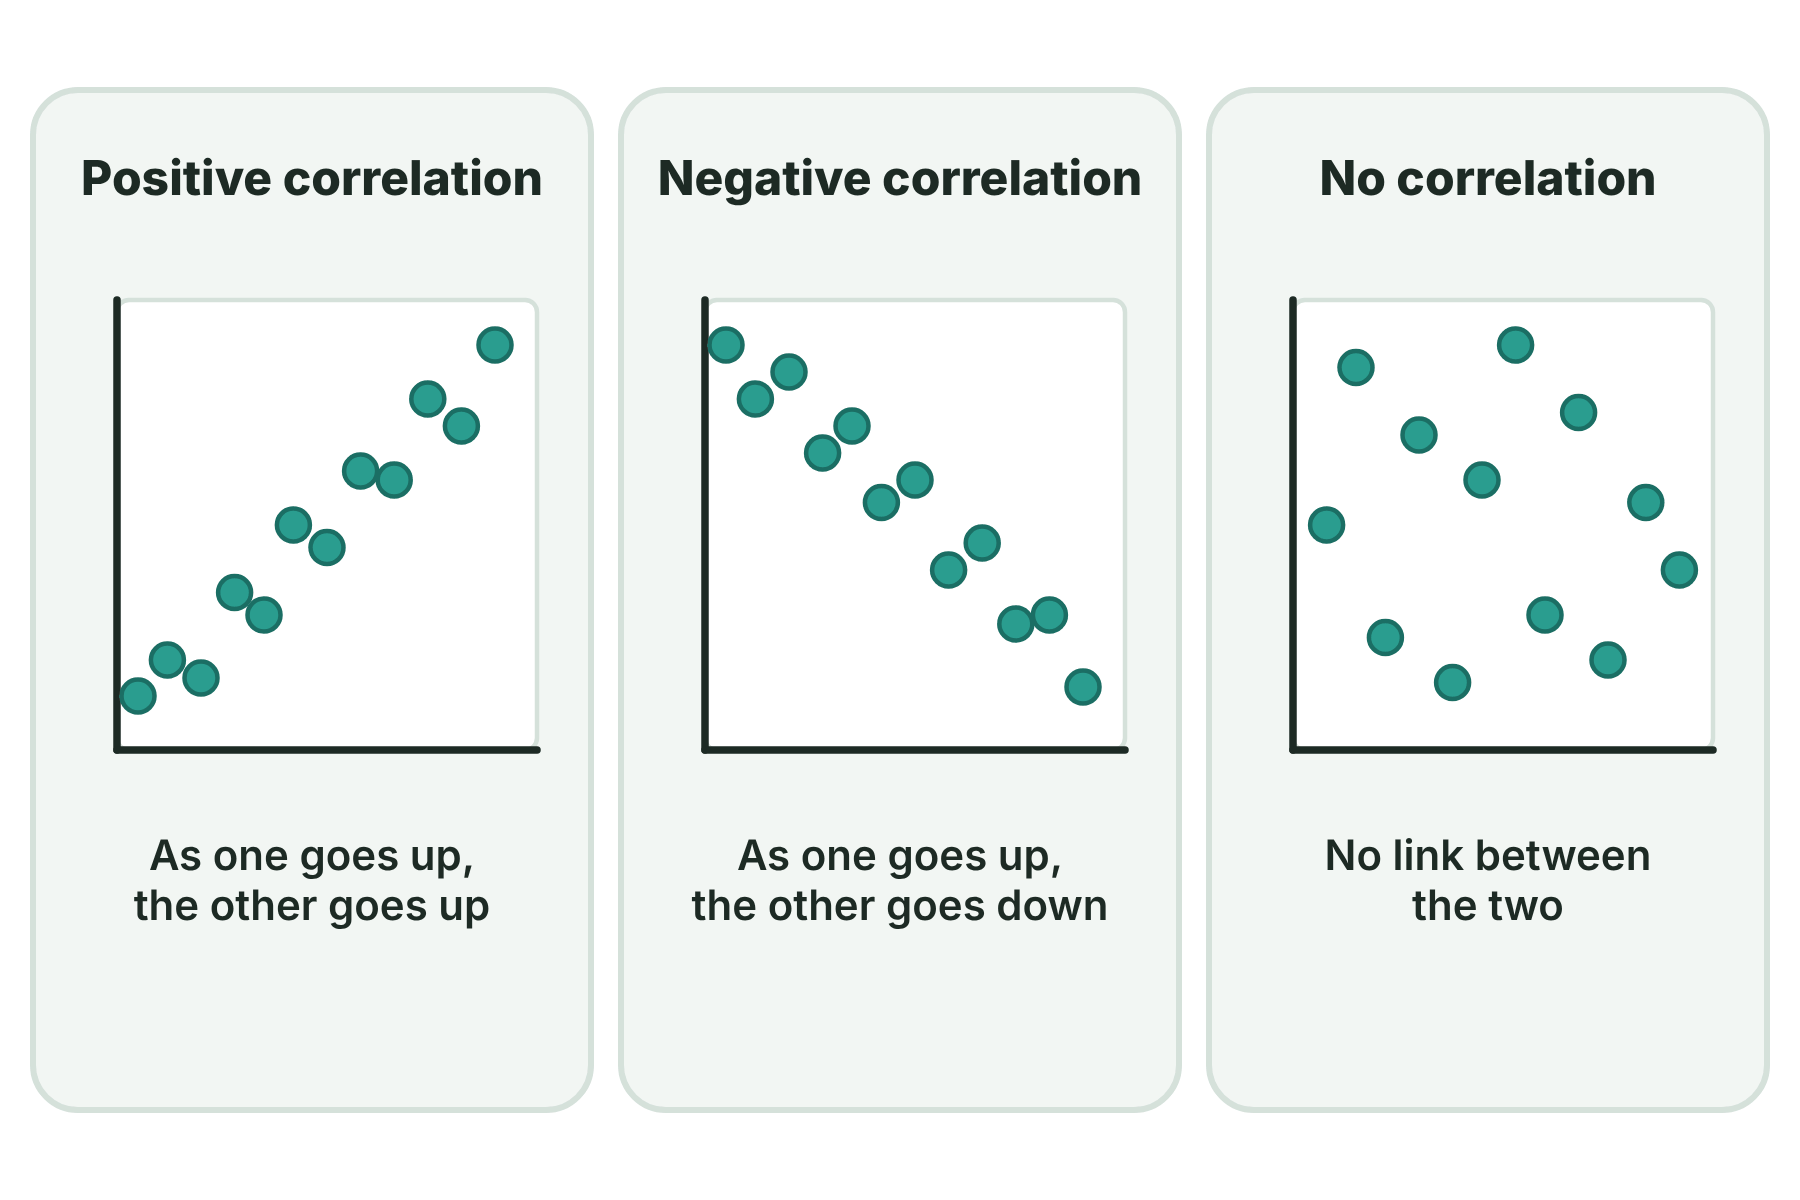
A correlation shows a link between two variables. It does not prove that one causes the other.
Describing a correlation
A study of 200 adults finds that as the number of hours of exercise per week increases, the resting heart rate falls. What type of correlation is this, and does it prove that exercise lowers heart rate?
Show the solutionHide the solution
- 1 Describe the pattern As one variable goes up, the other goes down, so it is a negative correlation.
- 2 Think about cause A correlation shows a link only. Other factors, such as age or diet, may also be involved.
- 3 Say what would help A causal link needs a proven mechanism or a controlled investigation.
AnswerIt is a negative correlation. It does not prove that exercise causes the lower heart rate.
Case study
HIV and the immune system
HIV is a virus that infects the white blood cells of the immune system. Over time the number of working white blood cells falls, and the person can no longer fight off other infections or some cancers. This late stage is called AIDS. It is a clear example of one disease making others far more likely.
The big idea
Health is physical and mental well-being, and diseases of different types often affect each other.
Health and disease
Health and disease
-
Health
- physical and mental well-being
-
Communicable
- caused by pathogens
- spreads
-
Non-communicable
- not caused by pathogens
- cannot be caught
-
Interactions
- weak immune system
- viruses and cancer
- allergies
- mental health
-
Data
- tables
- bar charts
- histograms
- scatter diagrams
- sampling
Summary and exam focus
- Health is a state of physical and mental well-being.
- Communicable diseases are caused by pathogens and can be passed on, but non-communicable diseases cannot.
- A weak immune system, viruses, allergies and severe illness link different diseases together.
- A scatter diagram shows whether two variables are correlated.
- Samples of data should be large and representative.
Exam focus
Explain how a communicable disease and a non-communicable disease can affect each other. (4 marks) (4 marks)
Use specific examples. For instance, a virus such as HPV living in cells can trigger a cancer, and an immune system damaged by HIV allows other infections to take hold.
Key terms
The words this lesson expects you to use. Each one is linked from the first place it appears above.
- Health
- The state of physical and mental well-being.
- Communicable disease
- A disease caused by a pathogen that can be passed from one organism to another.
- Non-communicable disease
- A disease that is not caused by a pathogen and cannot be passed on.
- Immune system
- The body's defence against pathogens, made up of white blood cells and the antibodies they produce.
- Allergy
- An over-reaction of the immune system to a harmless substance, such as a skin rash or asthma.
- Correlation
- A pattern showing that two variables change together.
- Scatter diagram
- A graph that plots two variables against each other to show whether they are correlated.
- Sample
- A smaller group of individuals chosen to represent a whole population.
You've finished the notes
Check your understanding
Test yourself while it is fresh. Start with the flashcards, then try the exam questions.
Something here looks wrong?
Tell us what and we will go and look. It goes to whoever writes these pages, nobody else, and we do not ask who you are — so there is nothing to sign and nothing comes back to you.